

1. Introduction
2. Background of Program
2.1 Concept of AI based deep excavation analysis
2.2 Program platform
3. Ai-based Prediction
3.1 General overview
3.2 Database development
4. Development of Ann-excav
4.1 Program overview
4.2 Input module
4.3 Excavation evaluation module
4.4 Stability check
5. Program evaluation using field data
5.1 Example case description
5.2 Validation results of program modules
6. Conclusions
1. Introduction
Increasing population has increased the importance of underground space construction for subways, high rise building foundations etc. while, working on these construction facilities we need to excavate deeper and to support these deep excavations, support walls and support members are used, but working at greater depths beneath the ground poses many challenges. One of the main challenges is to predict the stresses, induced by the forces generated by earth pressures of ground layers, on such support wall structures. In common practice, for support wall and support member design purpose, these predictions are made by some hefty, pressure and stress, calculations. These days people are trending to include IT applications for the prediction of such induced parameters in deep excavation works. The most important technique of IT that best suits this objective is artificial intelligence (AI), that has a known ability to learn and recall the predicted values. The current study concentrates on using AI technique in conjunction with numerical analysis to use it as a handy tool for automated design parameter prediction for support wall member structures for deep excavations.
In recent years, trend of using information technology (IT), such as artificial intelligence (AI) and programming language (C++, C#, VB)to develop automated prediction and visualization systems, has been increased. A variety of programs have been developed in a similar fashion with different implementation and scope. For example, Yoo et al. (2010) developed an ANN based underground excavation design system that combined IT and numerical analysis for design and planning of underground structures, it coupled the ANN technique and numerical analysis. Yoo et al. (2005) developed an ANN based tunnelling risk management system, which performed first-order assessment of tunnelling induced third party impact (groundwater effect, ground movement and building damages) on the surrounding environment, it coupled AI and numerical analysis techniques with GIS. Also, many studies have been presented to document the evidence that AI can predict the parameters, induced due to deep excavation activities, with greater accuracies. For example, Chan et al. (1995) shown for driven pile that traditional pile driving formulas for the determination of pile bearing capacity can be replaced by properly trained ANN for smaller number of inputs. Kim, et al. (2001) shown that ANN based prediction procedures can be applied in many geotechnical engineering problems within its limitations. Shahin et al. (2001) summarised the applications of artificial neural network in geotechnical engineering. Kung et al. (2007) shown that wall deflection caused by braced excavation can be accurately predicted by the developed ANN. Researchers also found that AI and numerical analysis in conjunction can predict the parameters induced due to deep excavation activities with greater accuracies. For example, Farrokhzad et al. (2011) presented in a study that subsurface soil layering and landslide risk prediction are comparable to that of FEM and Bishop’s method. Rastbood et al. (2017) stated that the structural force of segmental tunnel lining can be predicted with greater accuracy by using FEM based ANN. Acharyya et al. (2018) presented a study to show that ANN can be successfully used to run the parametric study to check more influential inputs for the FEM models. Current study uses the same concept to introduce the prediction of forces induced due to the deep excavation activity and stability check of wall structure and support members by utilizing these predicted values.
In this paper, the AI-based program has been developed to provide a user-friendly platform that uses the ANN technique combined with numerical analysis to predict the induced effects, due to deep excavation, on support wall and support members and also, to check the stability of the proposed support system against these predicted effects. To achieve the objective, two main modules were developed that include, the input module and excavation evaluation module. The input module is mainly an input data entry module that stores and pass the entered data to the next module. Also, uses this data to draw a visual graphical image of excavation case. While, the excavation evaluation module that uses the input data from input module to use it in ANN calculations for the induced displacements, groundwater drawdown effects and wall and support member forces. Also, it performs the stability check by comparing predicted values to the standard design formulae-based values. The following sections present the details of ANN development, system structure and finally, the validity of current study.
2. Background of Program
2.1 Concept of AI based deep excavation analysis
One of the most widely used artificial intelligence (AI) techniques, artificial neural network (ANN), is increasingly becoming a standard AI technique for solving civil engineering related problems. ANN has been used by many people to predict different geotechnical engineering related parameters, such as pile capacity, soil particle size, wall deflections in soils, groundwater drawdown effects etc. But there are seldom any studies about the prediction of deep excavation induced forces using ANN in conjunction with numerical analysis. ANN techniques involve the development of database related to the deep excavation induced effects through numerical analysis, preparation of data sets for generalized ANN training, deployment of ANNs in required platform or problem case. This very concept is used in the present study.
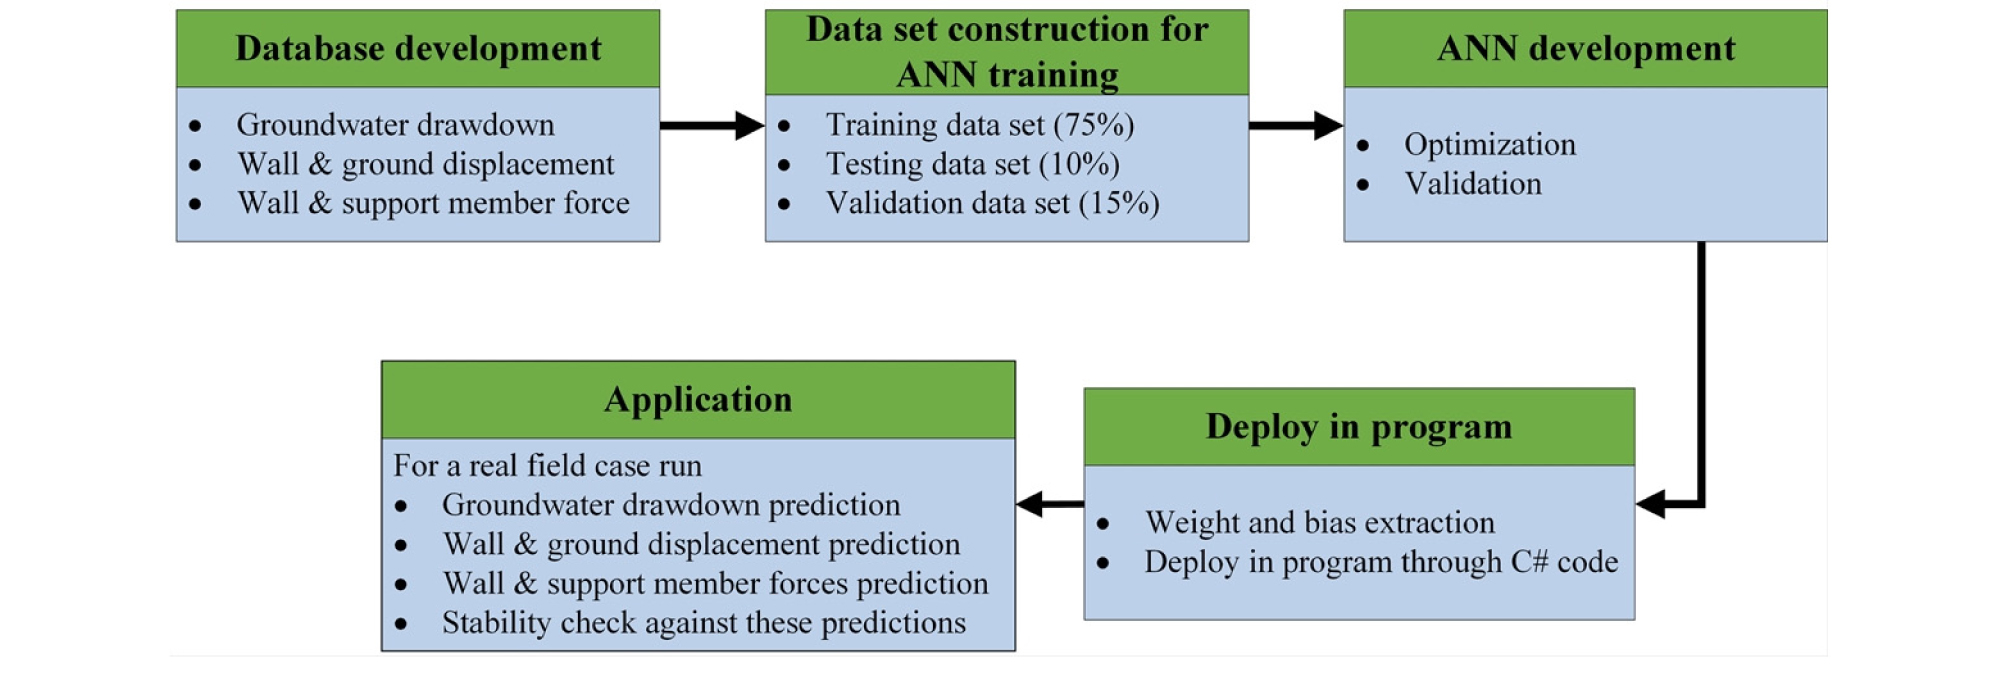
To apply this concept to current study first, the databases for wall and ground displacements, groundwater drawdown and wall & support forces, were prepared by numerical analyses. Then, these databases were used to train ANNs. After that, the trained ANNs were deployed in the program by using weights and bias obtained from trained ANN results. Steps adapted for implementation of this approach to the program are show in Fig. 1.
2.2 Program platform
Program was developed in C# environment that was compiled using Microsoft Visual Studio 2017. Screen resolution for GUI design was set at 1900 × 1050 on Microsoft Windows 8.1 OS (64 bit) with an updated .Net Framework v4.5. To run the program, the required configuration must be at least Microsoft Windows 7 OS with an updated v4.5 .Net Framework having screen resolution of at least 1600 × 900.
3. Ai-based Prediction
3.1 General overview
In order to train an ANN, the real field cases are needed to prepare a dataset that is further analysed through numerical analysis program to generate the databases. For current study, carefully prepared deep excavation cases for groundwater drawdown, wall and ground displacement and wall & support member forces, that represented the real field conditions, were analysed and modelled by using SeepW (GeoStudio, 2012), PLAXIS2D (Plaxis, 2010) and GeoXD (MIDAS, 2011) respectively to generate the databases. These databases were then used to train the ANNs using MATLAB (MathWorks, INC). Datasets prepared were assigned as 75% for training, 15% for validation and 10% for testing the ANNs.
3.2 Database development
Three types of databases were developed to train ANN for Wall and ground displacement, ground water drawdown and wall & support member forces modules respectively. Cases prepared for numerical analysis were similar to the field conditions frequently encountered in Korean deep excavation projects by considering the H-Pile wall, cast in place (CIP) wall and Soil cement (SCW) wall. The general description of input parameters used in the development of database to train the ANN are shown in Table 1. The soil model was simulated as mixed ground consists of three soil layers (Alluvium, weathered soil and weathered rock) having the material properties are shown in Table 2.
Table 1. General input used in ANNs training
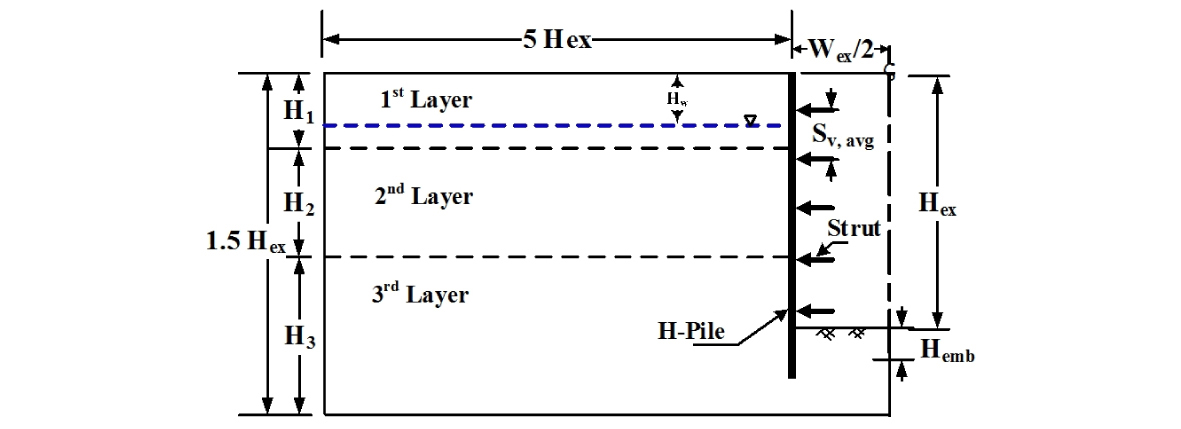
Table 2. General ground material properties
| Ground type | γ(kN/m3) | c΄(kPa) | E(kPa) | ∅(°) | ν |
| Alluvium | 18 | 5 | 15000 | 30 | 0.3 |
| Weathered soil | 18 | 10 | 30000 | 33 | 0.3 |
| Weathered rock | 20 | 20 | 80000 | 35 | 0.3 |
Wall and ground displacement and wall and support member forces database (DBs)were prepared considering the same range of input parameters but different analysis technique for both databases. Such as, to prepare the database for wall and ground displacements outputs the PLAXIS2D (Plaxis, 2012) FEM modelling program was used while for the wall and support member forces the commercial program GeoXD (MIDAS, 2011) was used. The 338 sections were carefully analysed by considering the number of input parameters such as excavation depth (Hex), excavation width (Wex),soil layer thickness (H), wall type (H-Pile, CIP and SCW wall), wall stiffness [(EI)w], initial strut location (ST1),strut length (Lst) and strut stiffness (Kst). The range of input parameters to prepare the above sections are shown in Table 3. All the inputs combine to give the required outputs, the relation between these inputs and outputs are rather complex that is why ANN technique is most suitable for the prediction of output parameters. Excavation depth and excavation width define the domain of the excavation profile, wall stiffness, strut stiffness, strut length and strut position control the wall deflections in a complex combination that can be very lengthy if done with traditional calculations. As, the study deals with the deep excavation cases so the ranges selected for the inputs are in accordance with the field cases. The target outputs for wall and ground displacement DB are wall lateral displacement, ground horizontal displacement and ground vertical displacement while in case of wall and support member forces DB the outputs are wall lateral displacement , wall shear force, wall bending moment and strut axial force.
Table 3. Data ranges wall and ground displacement and wall and support member forces DBs
| Data range | Hex (m) | Wex (m) | ST1 (m) | (EI)w (kNㆍm/m) | EI (kNㆍm/m) | Lst (m) | H (m) |
| Maximum | 15 | 12.5 | 0.5 | 19040 | 50316 | 12.5 | 0 |
| Minimum | 35 | 50 | 2.5 | 3485648 | 201264 | 50 | 36.75 |
For ANN developments the above both DBs data sets were further divided in to three subsets such as training set, testing set and validation set. In total 75% of the data were used for training, 15% for testing and remaining 10% for validation set. In terms of number of analysed sections, 254 sections were used for training and 51 sections were used for testing. The remaining 35 sections were used for validation. ANNs were trained with one hidden layer having 10 number of neurons through MATLAB (MathWorks, INC).
In case of groundwater drawdown database, the 128 cases were analysed using SEEP/W (GeoStudio 2012), modelling program. To make the data set the input parameters were considered according to real field conditions such as Hex, Wex, location of initial water (Hw) from ground surface, soil layers permeability and wall permeability as the range of input parameters are given in Table 4. As mentioned earlier that wall permeability and soil layer permeability directly govern the groundwater effects. Soil layers have more permeability naturally while wall permeability is less because it is intended to restrict the water passage through the wall. The target outputs are groundwater drawdown (mm) and groundwater level (mm). For the development of ANN same percentage of training, testing and validations set were considered with 96 sections were used for training and 19 and 13 sections were used for testing and validation respectively.
Table 4. Data ranges ground water drawdown DB
| Data range | Hex (m) | Wex (m) | Hw (m) | ks (m/s) | kw (m/s) |
| Maximum | 15 | 12.5 | 4 | 1.0x10⁻⁶ | 1.0x10⁻⁸ |
| Minimum | 35 | 50 | 8 | 1.0x10⁻² | 1.0x10⁻³ |
To show the predictive performance of trained ANN for above database and to check the accuracy of obtained weight and bias for the development of program, the trained ANN results are summarized in Table 5 in terms of three statistical parameters: the coefficient of determination (R2), the route mean square error (RMSE) and mean absolute error (MAE). As shown in Table 5 there is excellent correlation between the ANN predictions and the target values as the R2 values for all outputs lies over 99% with reasonably small value of RMSE and MAE.
Table 5. Data ranges ground water drawdown DB
4. Development of Ann-excav
4.1 Program overview
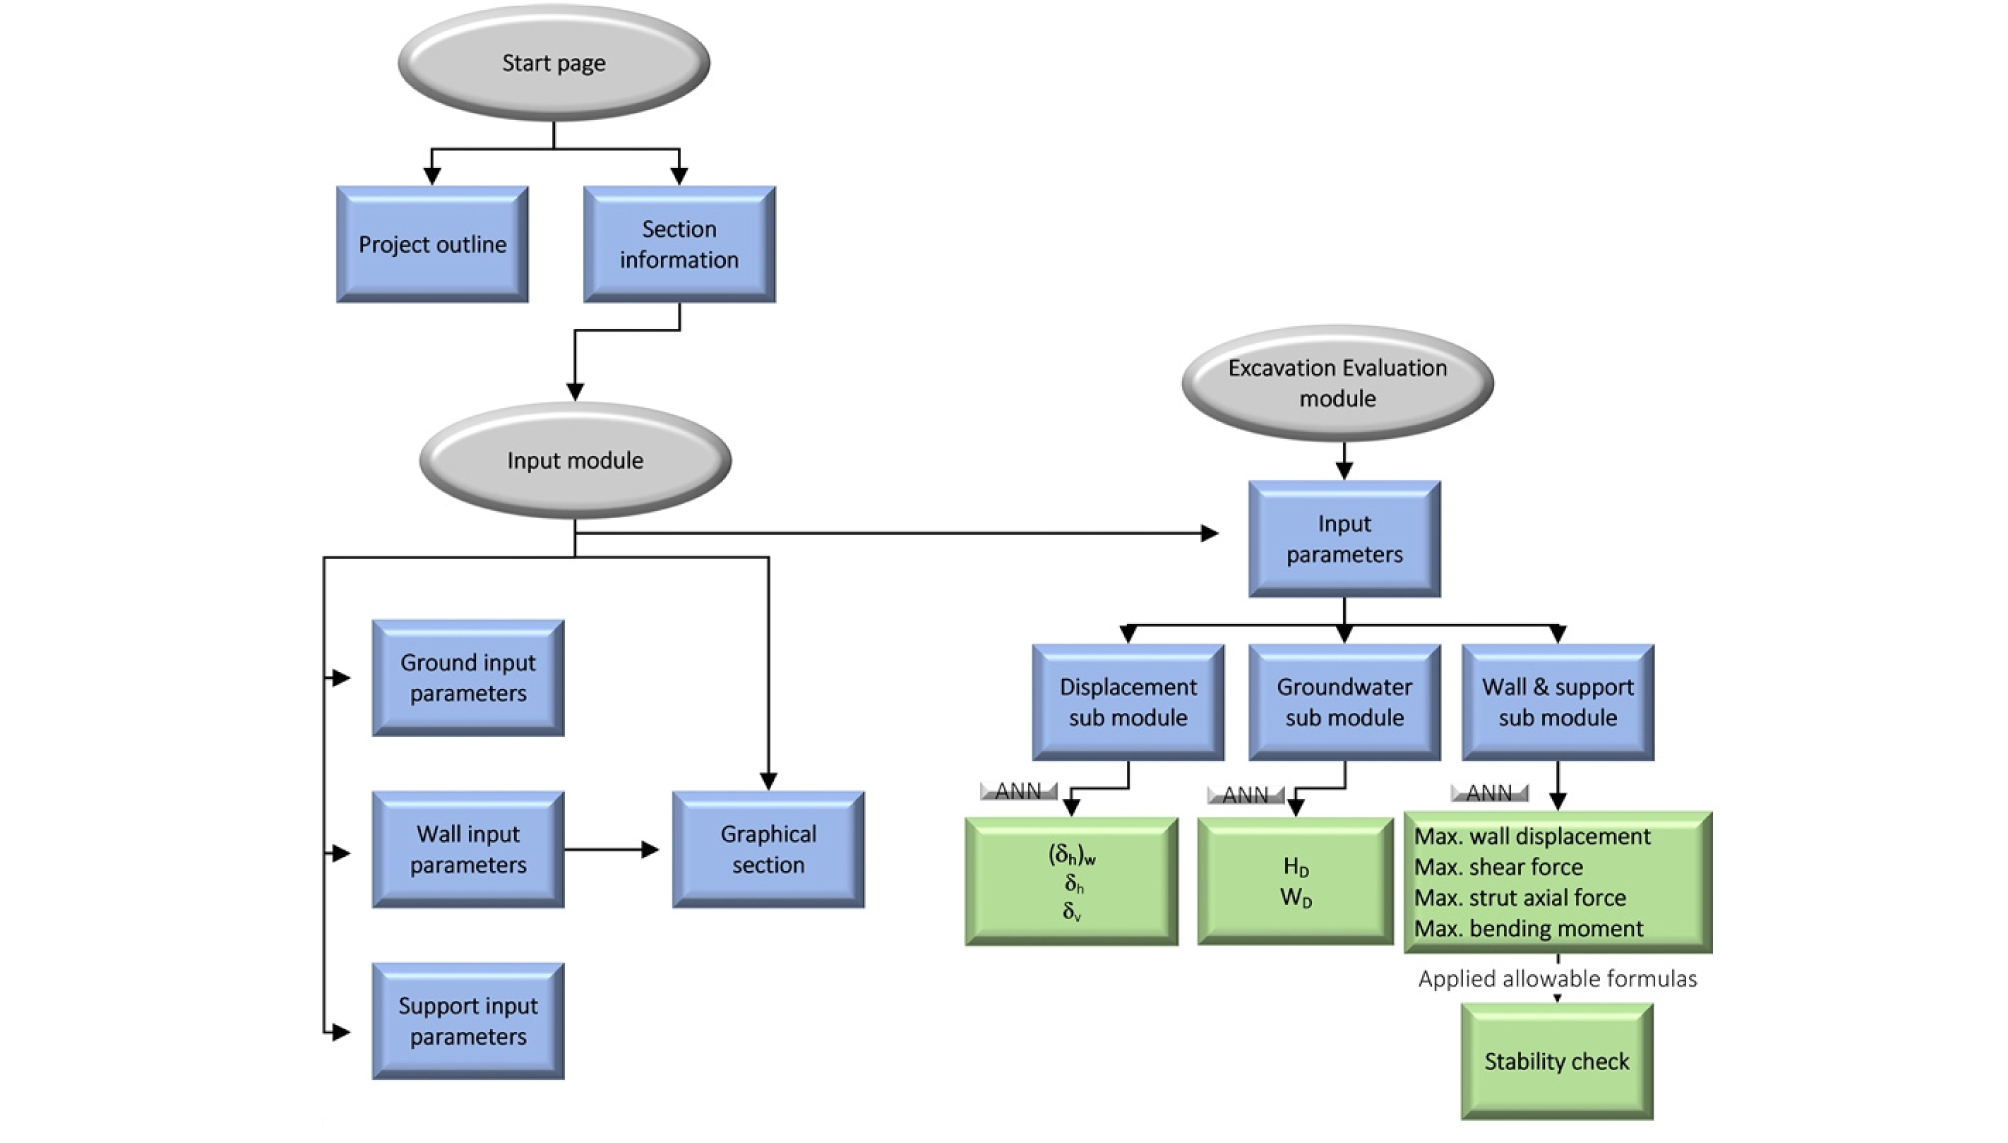
ANN-EXCAV performs ANN based prediction for three different databases and also performs the stability check for wall and support section. So, keeping this in mind, program was developed with four pages and two main modules i.e. Input module and excavation evaluation module respectively. From start page to the last page data flow functionality of the program is systematic. Module details are given in the relevant sections below. Fig. 2 shows the general overview of the program.
4.2 Input module
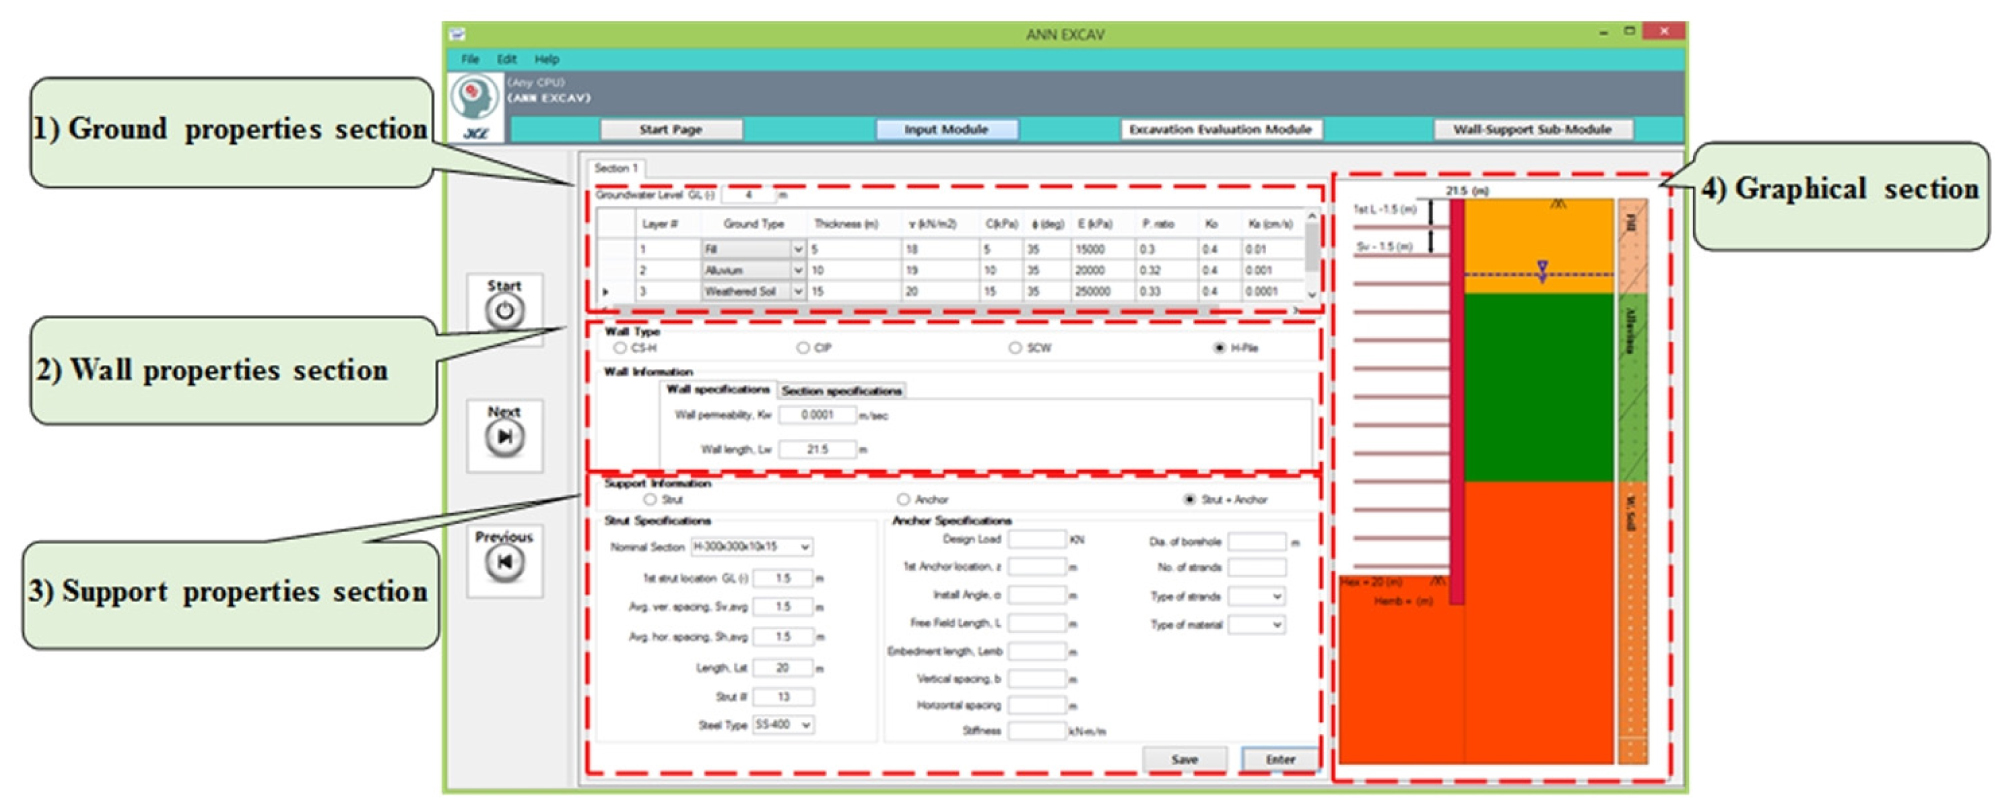
Input module serves as a data entry page for the program, this page is divided into four different section each for ground, wall, support and graphical section. first section contains specific ground input parameters to be used as inputs for ANN prediction within the program. Second section contains wall properties for three types of wall selections, i.e. CIP, SCW and H-Pile respectively. Each wall type has some specific inputs related to it. Third section contains support input parameters, currently only strut is included as a support member. Fourth section here shows a graphical profile of excavation case according to the entered input data. As the excavation cases used are symmetric so, only half of the portion of the profile is drawn. This section enables the user to visualize a general cross section of excavation profile in an effective way. Fig. 3 shows different sections of the input module with all the fields updated with a sample case and a graphical profile.
4.3 Excavation evaluation module
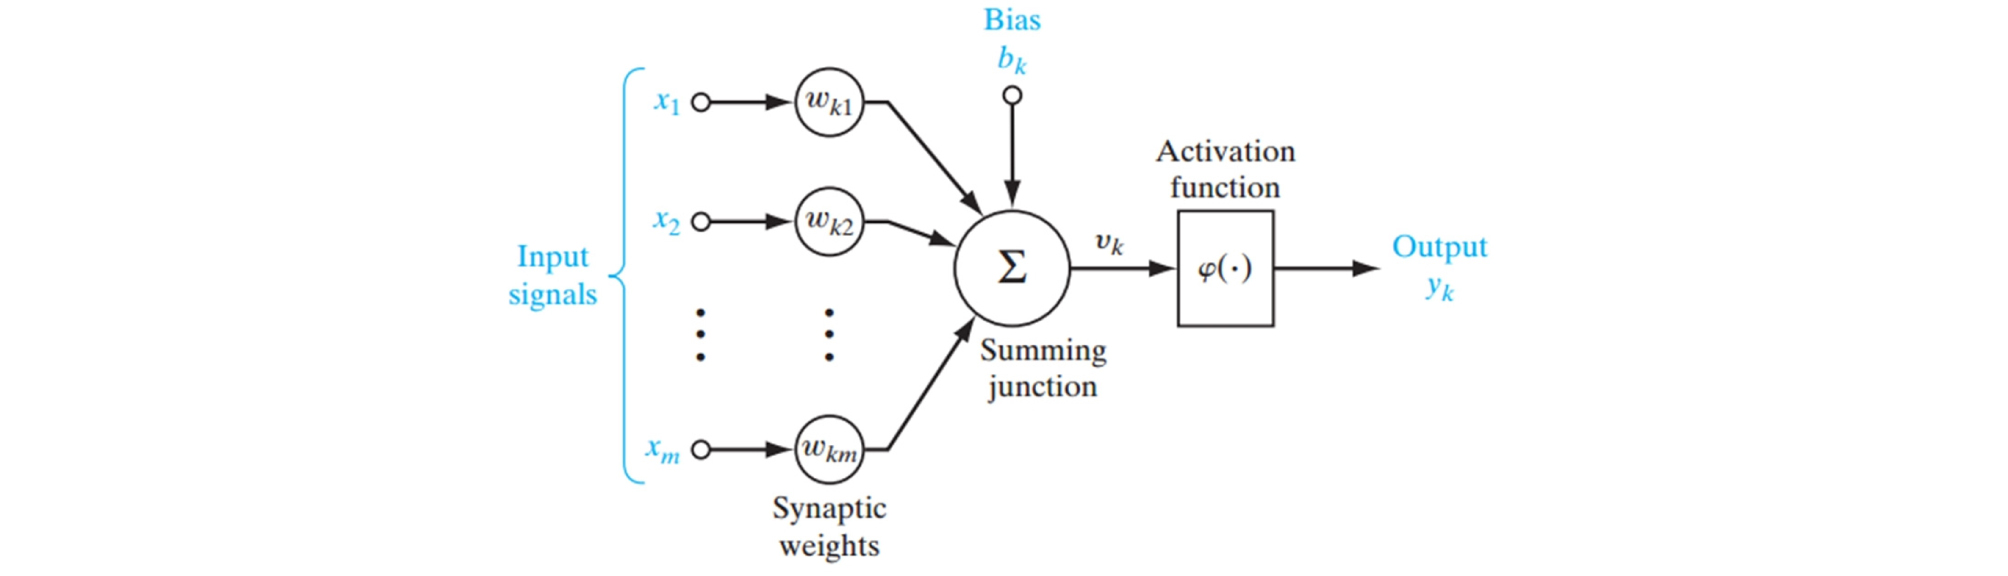
Excavation evaluation module performs the calculations based on ANN deployed in the program by using sigmoid transfer function Eq. (1)
| $$t_{n=1+f_2(W_{2\times}f_1(W_1(1-abs(2\times(p_{(n-1)+}b_1)+b_2)/2}$$ | (1) |
Where in Eq. (1), tn is target output value, n is normalized input value, W1 and W2 are weights for hidden and output layers respectively, b1 and b2 are Bias for hidden and output layers respectively, f1 is the logsigmoid function, which is the activation function of hidden layer and normalized the input to -1 or 1, which can be performed as shown in Eq. (2), where f2 is tansigmoid function as a transition function as given in Eq. (3)
| $$f_{1=f_{3=}}\log sig(n)=1/(1+\exp\times(-n))$$ | (2) |
| $$f_{2=}\tan sig(n)=2/(1+\exp\times(-2n))-1$$ | (3) |
Where in Eq. (2), n = normalized output of Eq. (3), while in Eq. (3), n = normalized output of central part of Eq. (1). Eq. (1) is basically a simulation equation that MATALB (MathWorks, INC.) uses to calculate the output for a specific parameter based on the assigned weights and bias with respect to the number of hidden layer nodes. General flow of the equation to calculate the weighted output is shown in Fig. (4). In program Eq. (1) is replicated by C# code in the form of a complex matrix calculation class. This class takes input from user, normalize it, apply Eq. (1) matrix to calculate output and finally denormalize the output to show the final value to the user.
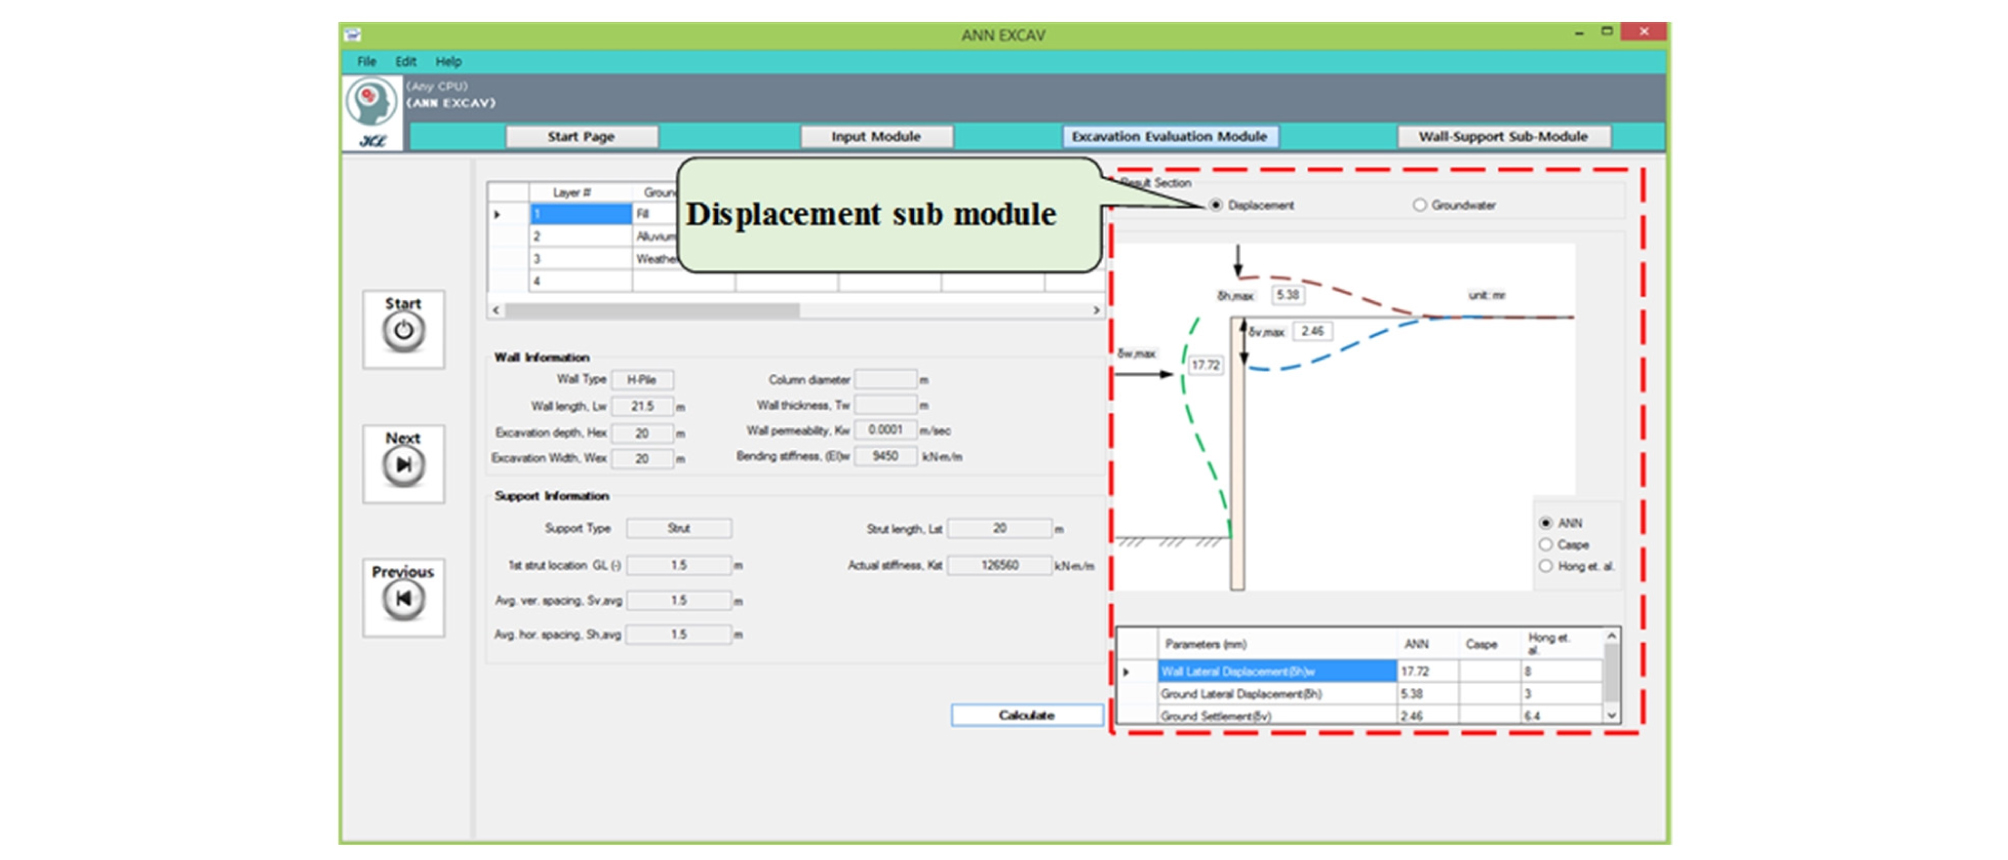
4.3.1 Displacement sub module
Displacement sub module calculates wall lateral displacement, ground lateral displacement and ground vertical displacement based on ANN. This sub module was developed by using weights and bias of the wall and ground displacement trained ANNs, so it is worth noting that the ranges for input parameters used in training the ANN should be kept in mind and inputs in the program must be within these ranges, otherwise ANN prediction may be erroneous. Input and output parameters and input ranges for this sub module are mentioned in Table 3. Fig. 5 shows the displacement sub module result page with result outputs of a sample case.
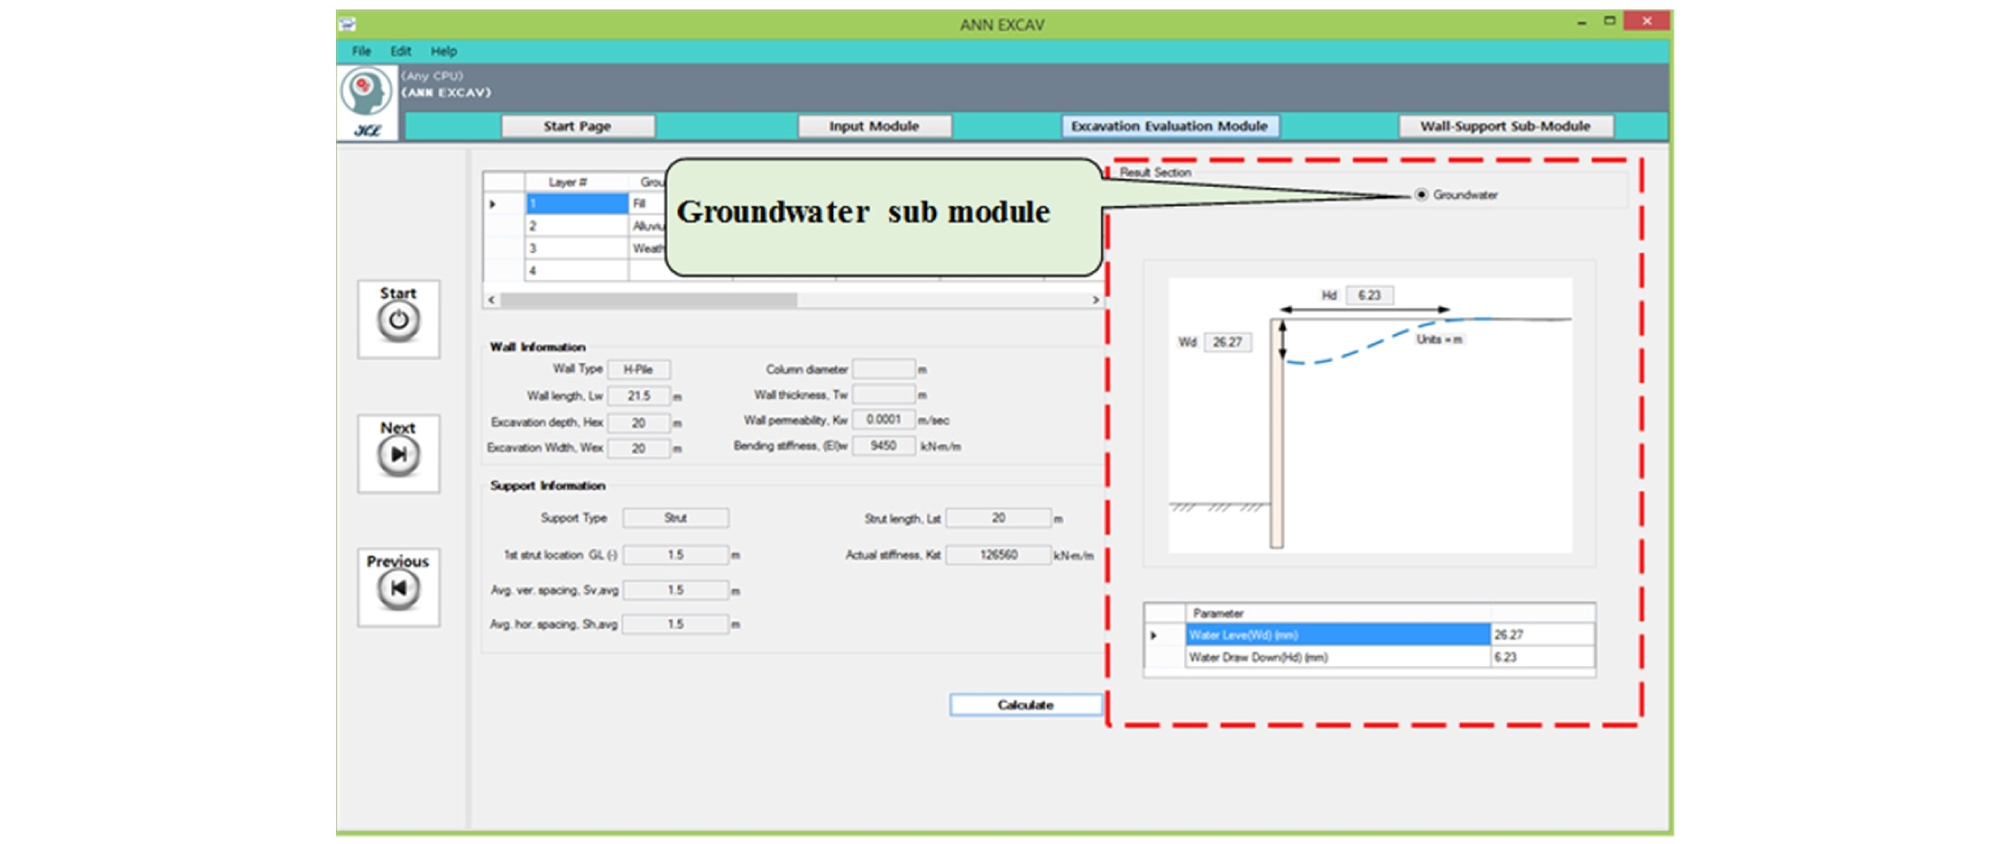
4.3.2 Groundwater sub module
Groundwater sub module calculates groundwater drawdown and groundwater level based on ANN. The module was developed by using weights and bias of the groundwater drawdown trained ANNs, so, input ranges used for training must be considered when entering data. Input, output parameters and input ranges of this module are mentioned in Table 4. Fig. 6 shows the groundwater sub module result page with result outputs of a sample case.
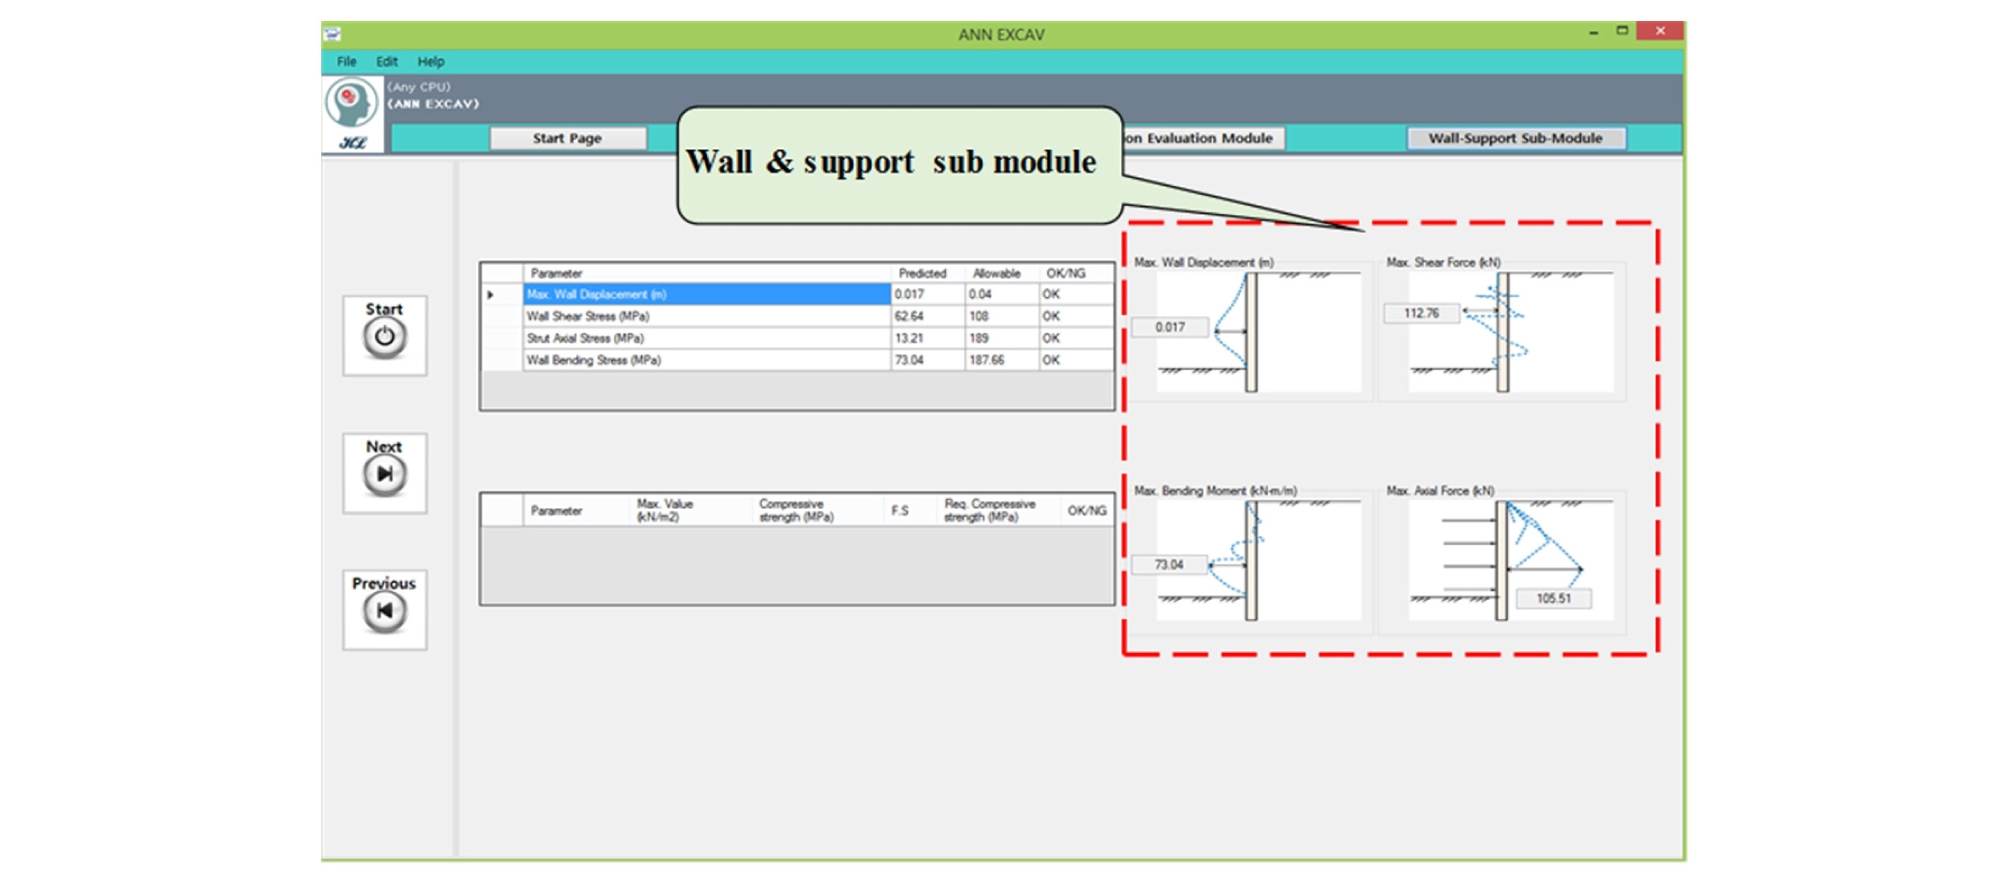
4.3.3 Wall and support sub module
Wall and support sub module calculate max. wall displacement, max. wall shear force, max, wall bending moment and max. strut axial force based on ANN. These forces are supposed to be generated due to the effect of excavation activity. The module was developed by using weights and bias of the wall and support member forces trained ANNs, so input ranges for ANN calculation must be considered to avoid any erroneous calculations. Input, and output parameters and input ranges of this module are mentioned in Table 3. Fig. 7 shows the wall and support sub module result page with result outputs of a sample case.
4.4 Stability check
Stability check is a part of excavation evaluation module. In this section applied stresses are calculated by standard formulas using the ANN predicted forces. These applied stresses are then compared with the allowable stresses to check whether the wall, under the given conditions is within the allowable limits or not. If the applied value is equal to or less than the allowable value, then the status of the wall for that particular parameter is OK while in the reverse case it is shown as NG (not good). This stability check allows the user to decide that whether under the given conditions specific wall is performing well or not. If any value comes out to be NG, either wall can be changed or wall parameters can be changed according to the required criteria of stresses.
Table 13. Validation results for wall and support submodule 5. Program evaluation using field data
5.1 Example case description
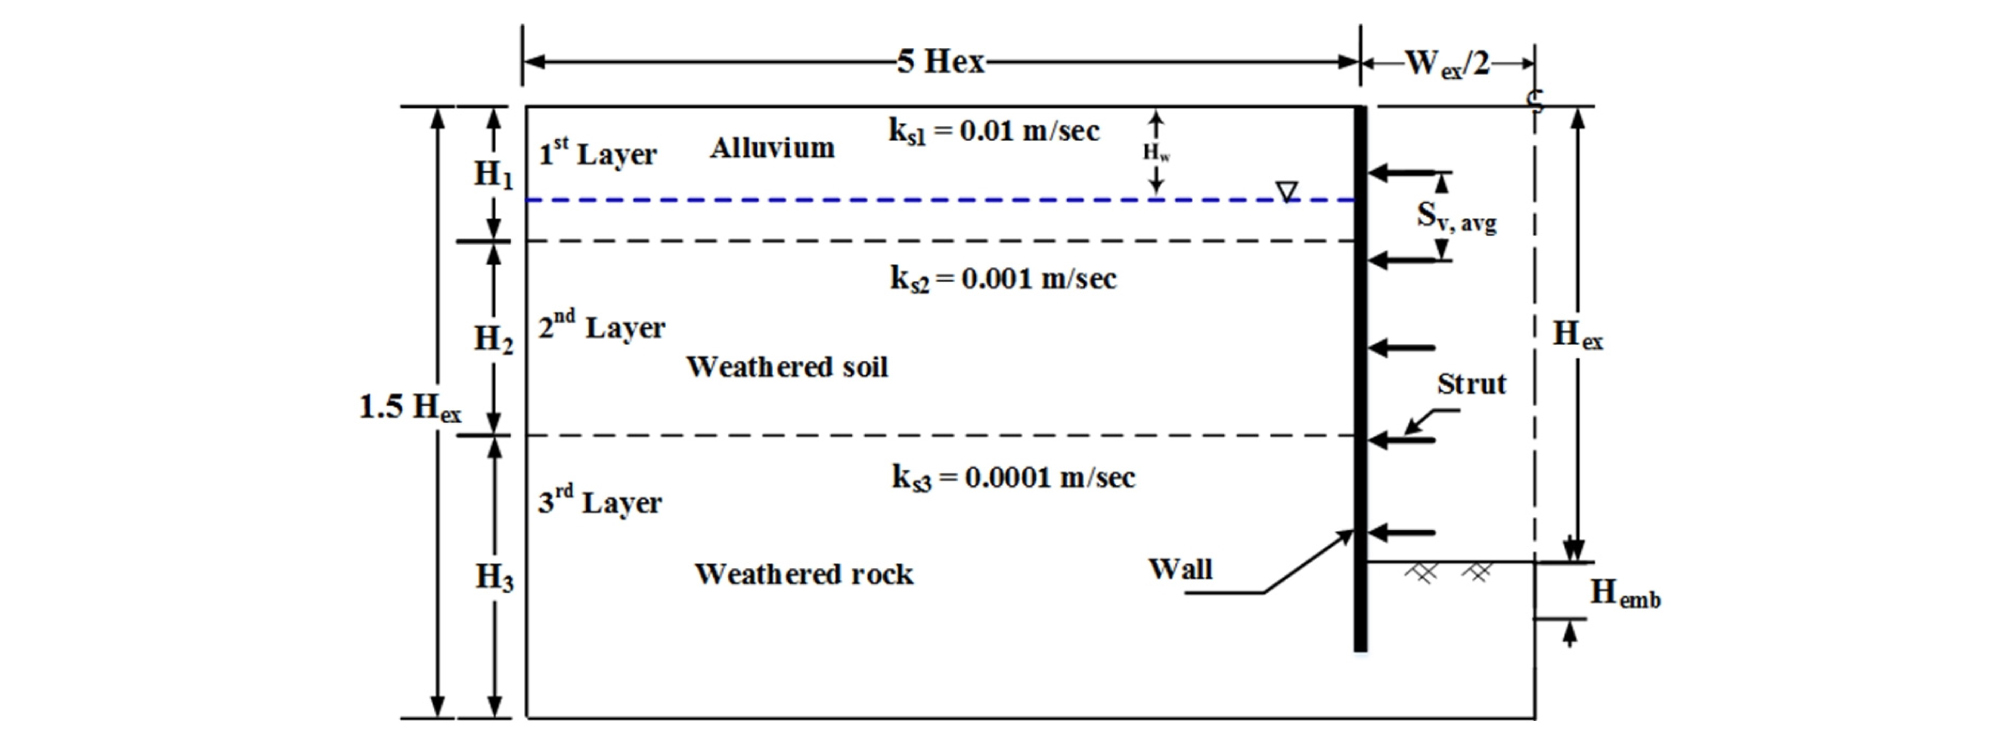
The developed program was implemented to a real field deep excavation case, that had the total depth of 30 m, which consisted of three ground layers (Alluvium soil, Weathered soil and weathered rock) and water table depth at 4 meters from the ground level, obtained from a drilled borehole data. Site was excavated up to 20 m depth with the ground layer properties shown in Table 6, while excavation case is described in Fig. 8.
Table 6. Ground and support input parameters
| Hex | Wex | Htotal | Hw | Soil layers | Layers permeability | ||||
| H1 | H2 | H3 | ks1 | ks2 | ks3 | ||||
| m | m | m | GL-(m) | m | m | m | m/s | m/s | m/s |
| 20 | 20 | 30 | 4 | 5 | 10 | 15 | 0.01 | 0.001 | 0.0001 |
A typical section of 9 strut support members was used to support the wall structure. Specifications of the support members used are given in Table 7.
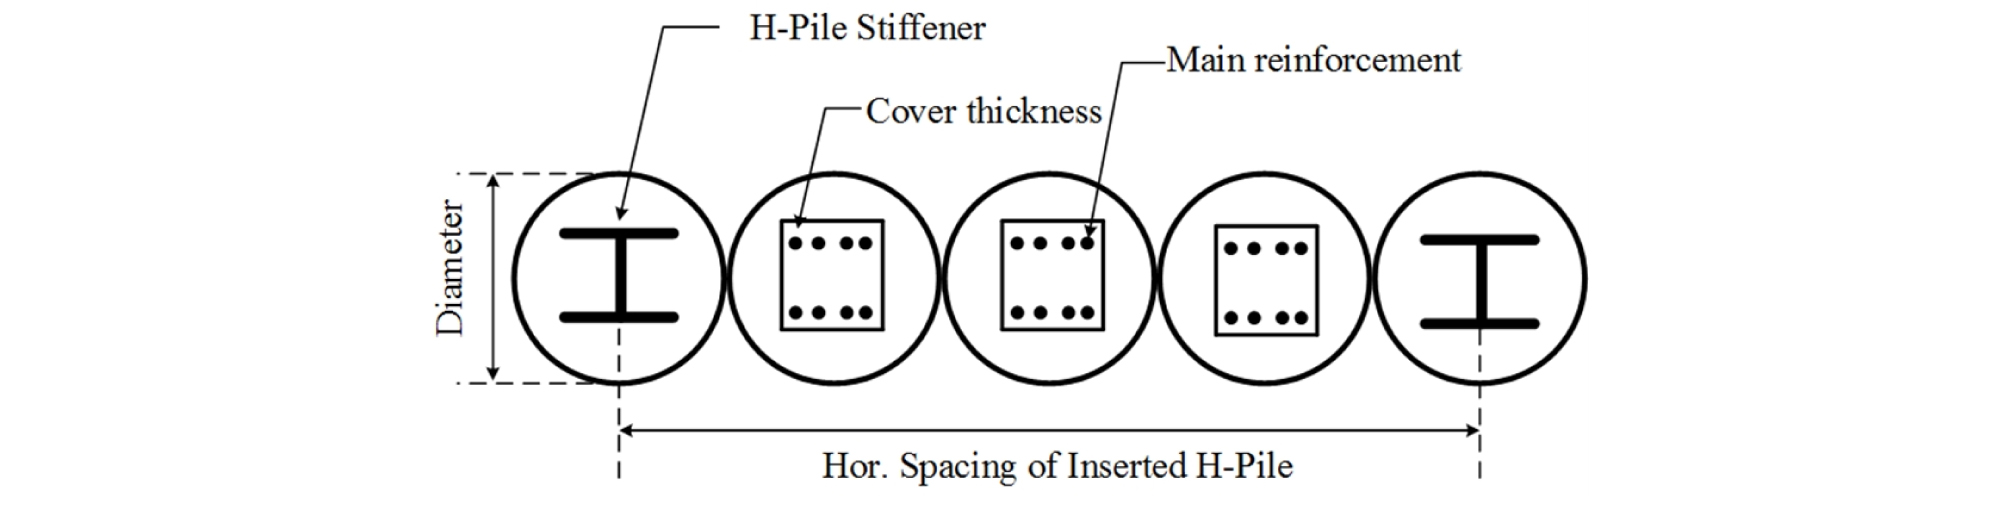
H-Pile continuous wall was used to support the excavation but for demonstration purpose same case is used for CIP and SCW as well. Wall specifications for H-Pile, CIP and SCW are presented in Table 8, Table 9 and Table 10 respectively. Fig. 9 and Fig. 10 explain the wall parameters for CIP and SCW respectively.
Table 7. Strut parameters
| Nominal section | ST1 GL-(m) | Sv,averg m | Sh,averg m | Nst | Lst m | Steel type |
| H-300x300x10x15 | 1.5 | 2 | 1.5 | 9 | 20 | SS400 |
Table 8. H-Pile wall parameters
| Wall section | Lw (m) | Hori. spacing (m) | kw (m/s) | Steel type |
| H-300x300x10x15 | 21.5 | 1.5 | 0.0001 | SS400 |
Table 9. CIP wall parameters
| Lw (m) | C.T.C (m) | kw (m/s) | Stiffner type | S. Reinf | M. Reinf | N. main | S. Shear (mm) | Dcol (m) | fy (MPa) | fc (MPa) | tc (mm) |
| 21.5 | 1.5 | 0.0001 | H-300x300x10x15 | D16 | D16 | 3 | 300 | 0.55 | SD300 | C27 | 100 |
Table 10. SCW parameters
| LW (m) | H. Stiff spacing (m) | kw (m/s) | Stiffener type | Dcol (m) | Col overlap (m) |
| 21.5 | 1.5 | 0.0001 | H-300x300x10x15 | 0.55 | 0.1 |

5.2 Validation results of program modules
Results obtained from the program for the deep excavation case illustrated in above section are presented in Tables 11 through 13. Result tables show the program calculated values based on ANN while for validation purpose hand calculated ANN values are also shown in tables.
Table 11. Validation results for groundwater submodule
| Parameters | CIP | H-Pile | SCW | |||
| Program | Calculated | Program | Calculated | Program | Calculated | |
| WD (mm) | 26.11 | 26.11 | 26.11 | 26.11 | 26.11 | 26.11 |
| HD (mm) | 6.14 | 6.14 | 6.14 | 6.14 | 6.14 | 6.14 |
5.2.1 Groundwater submodule results
Groundwater sub module results are presented in Table 11. The results from the program are obtained by implemented ANNs. The outputs for this module are groundwater drawdown and ground water level that are subjected to the change by deep excavation. At first the implemented ANN equations are checked for their validity by comparing the obtained results with hand calculated results. Both results are same, which shows that transformation of Eq. (1) into the C# code is successfully done, with comparable accuracy to hand calculations and also MATLAB returned outputs. Second, results for same outputs for different types of walls are compared. For the sake of parity, the properties of the walls were kept same so that ANN validity can be check against the influential input parameters affecting the groundwater behavior.
As the ANN training is highly dependent upon the type of input parameters and relation between inputs and outputs are made on the basis of the percentage of contribution of a specific input to obtain an output, that influence of the specific inputs can be check by the parametric study which, is beyond the scope of this paper. For groundwater drawdown and groundwater level the controlling input parameters are permeability of the soil layers and permeability of the wall. As these inputs are kept constant for all wall types the results obtained are the same that shows the importance of input parameters for ANN training.
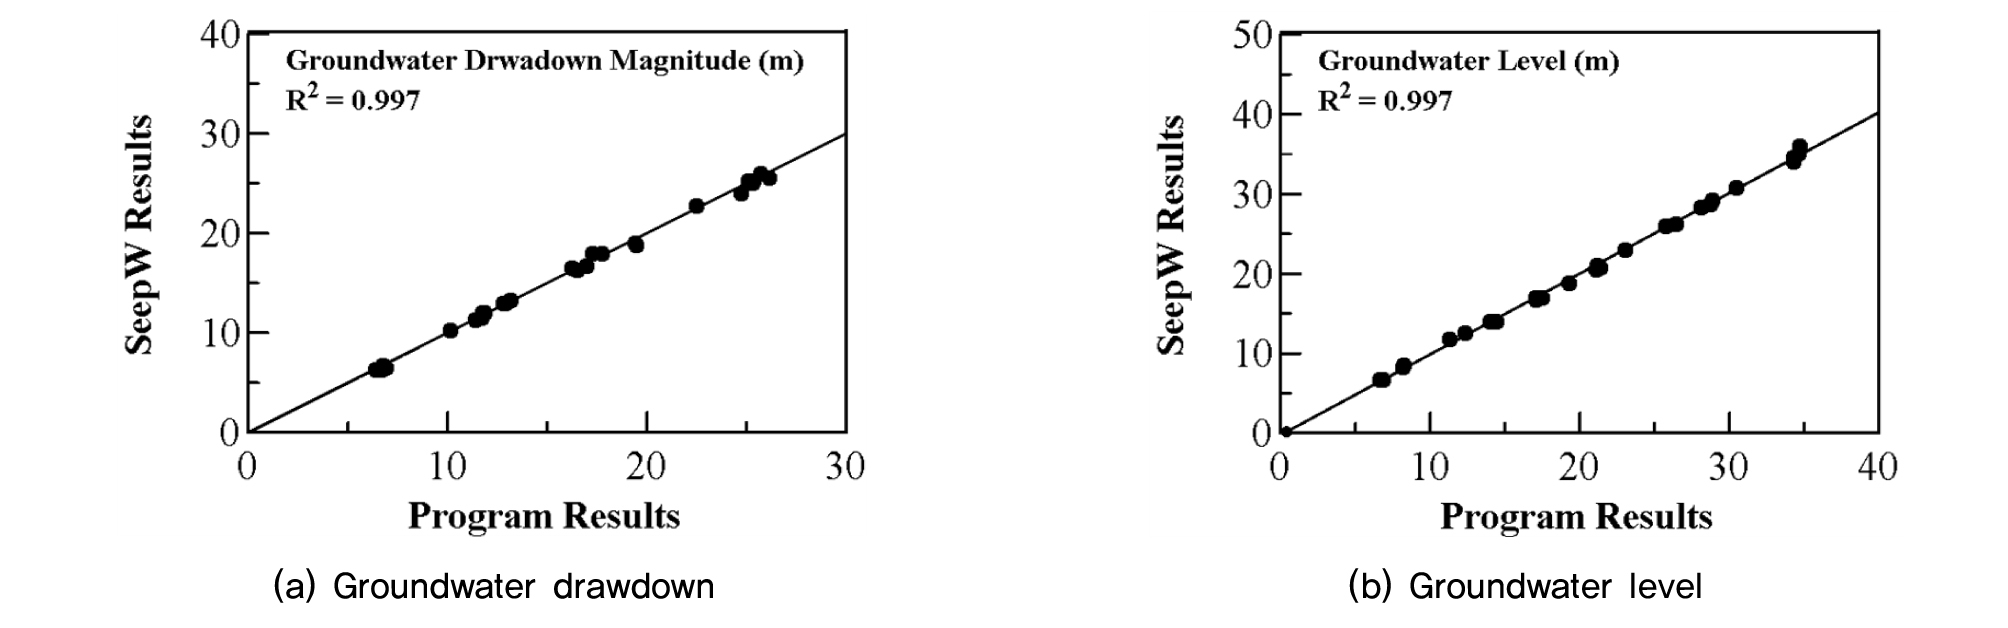
Also, the program results are validated by comparing the program results or predicted values with SeepW generated datasets.
Fig. 11 shows the comparison results for Groundwater drawdown and Groundwater level. R2 values for groundwater drawdown and groundwater level are 0.997 that indicates that program results are almost same as the SeepW datasets. this results also, depicts that ANNs are training with high accuracy.
5.2.2 Wall and ground displacement results
Wall and ground displacement sub module results are presented in Table 12. The program results are all based on ANNs. The outputs for this module are Wall displacement, Ground vertical and lateral displacements. Same procedure followed to compare the results for program and hand calculations and different wall types. Results show that program calculations are in accordance with that of hand calculations that ensures the right implantation of Equations in program. Results for different types of walls are also documented in above table. Consistent results are obtained for different types of walls.
Table 12. Validation results for displacement submodule
| CIP | H-Pile | SCW | ||||
| Program | Calculated | Program | Calculated | Program | Calculated | |
| (dh)w (mm) | 22.42 | 22.42 | 22.42 | 22.42 | 22.42 | 22.42 |
| dh (mm) | 5.95 | 5.95 | 5.95 | 5.95 | 5.95 | 5.95 |
| dv (mm) | 3.98 | 3.98 | 3.98 | 3.98 | 3.98 | 3.98 |
Displacements induced in wall and ground are related to the stiffness of the wall and Ground layers properties such as layer thickness, total height and elastic modulus. These ground properties were kept constant throughout. Also, stiffness inputs for the wall were kept constant because type of wall was not included as a parameter in ANN training. Same results for different types are in compliance with the fact that the stiffness properties of wall and ground were not changed for the said problem for different wall types.
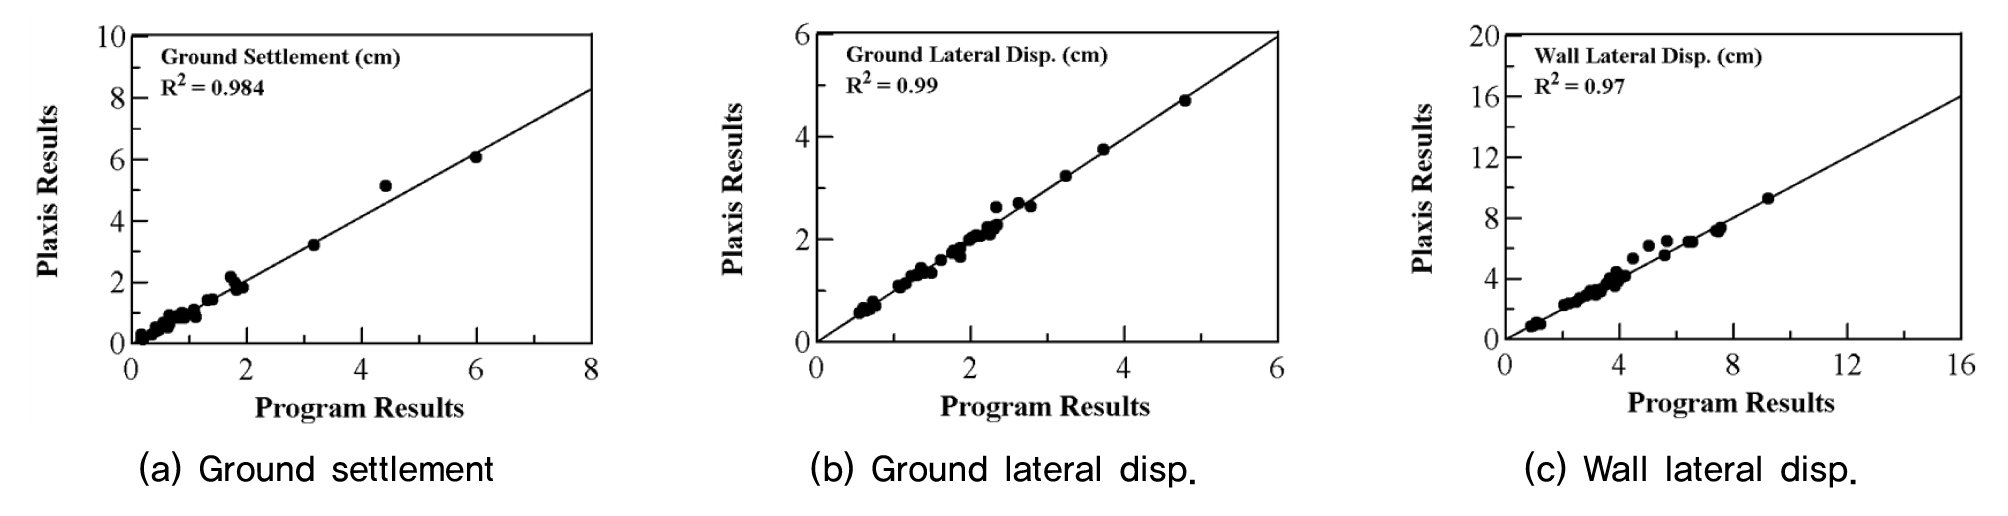
Fig. 12 shows the comparison results for wall displacement sub module results with Plaxis datasets that are used to generate ANN. R2 values for ground settlement, ground lateral displacements and wall lateral displacement are 0.984, 0.99 and 0.97 respectively, that show the high reliability of the implemented ANN and program calculations.
5.2.3 Wall and support sub module results
Wall and support sub module results are presented in Table 13. These results are based on ANN calculations implemented in the program. Validation process for checking the correct implementation of required ANN equation was same as of the two previous sub modules. Validation results are also of same kind, i.e. no error in implementation of ANN equations. Output results for different wall types are also compared. This module uses independent ANN that considers the inputs such as wall type, wall stiffness, support type and support stiffness in particular. So, even stiffness of the wall is kept constant for all the results for displacement vary due type of wall considerations.
Wall displacements are larger for Soil cement wall as it has no or less reinforcements within the wall structure as compared to other types such as CIP and H-pile wall. Shear stresses and strut axial stresses lie within close range for all type of walls as the conditions for these stresses are same such as backfill soil pressure or strut stiffens, while moment generated within the walls has quite a difference because it depends upon wall type and stiffness of the wall while ground properties are same for all walls. It can be seen that walls with reinforcements either shear or tensile have increased system stiffness hence less moments developed as in case of CIP or H-Pile walls, while SCW being only a soil cement wall has developed larger moments and shear stresses.
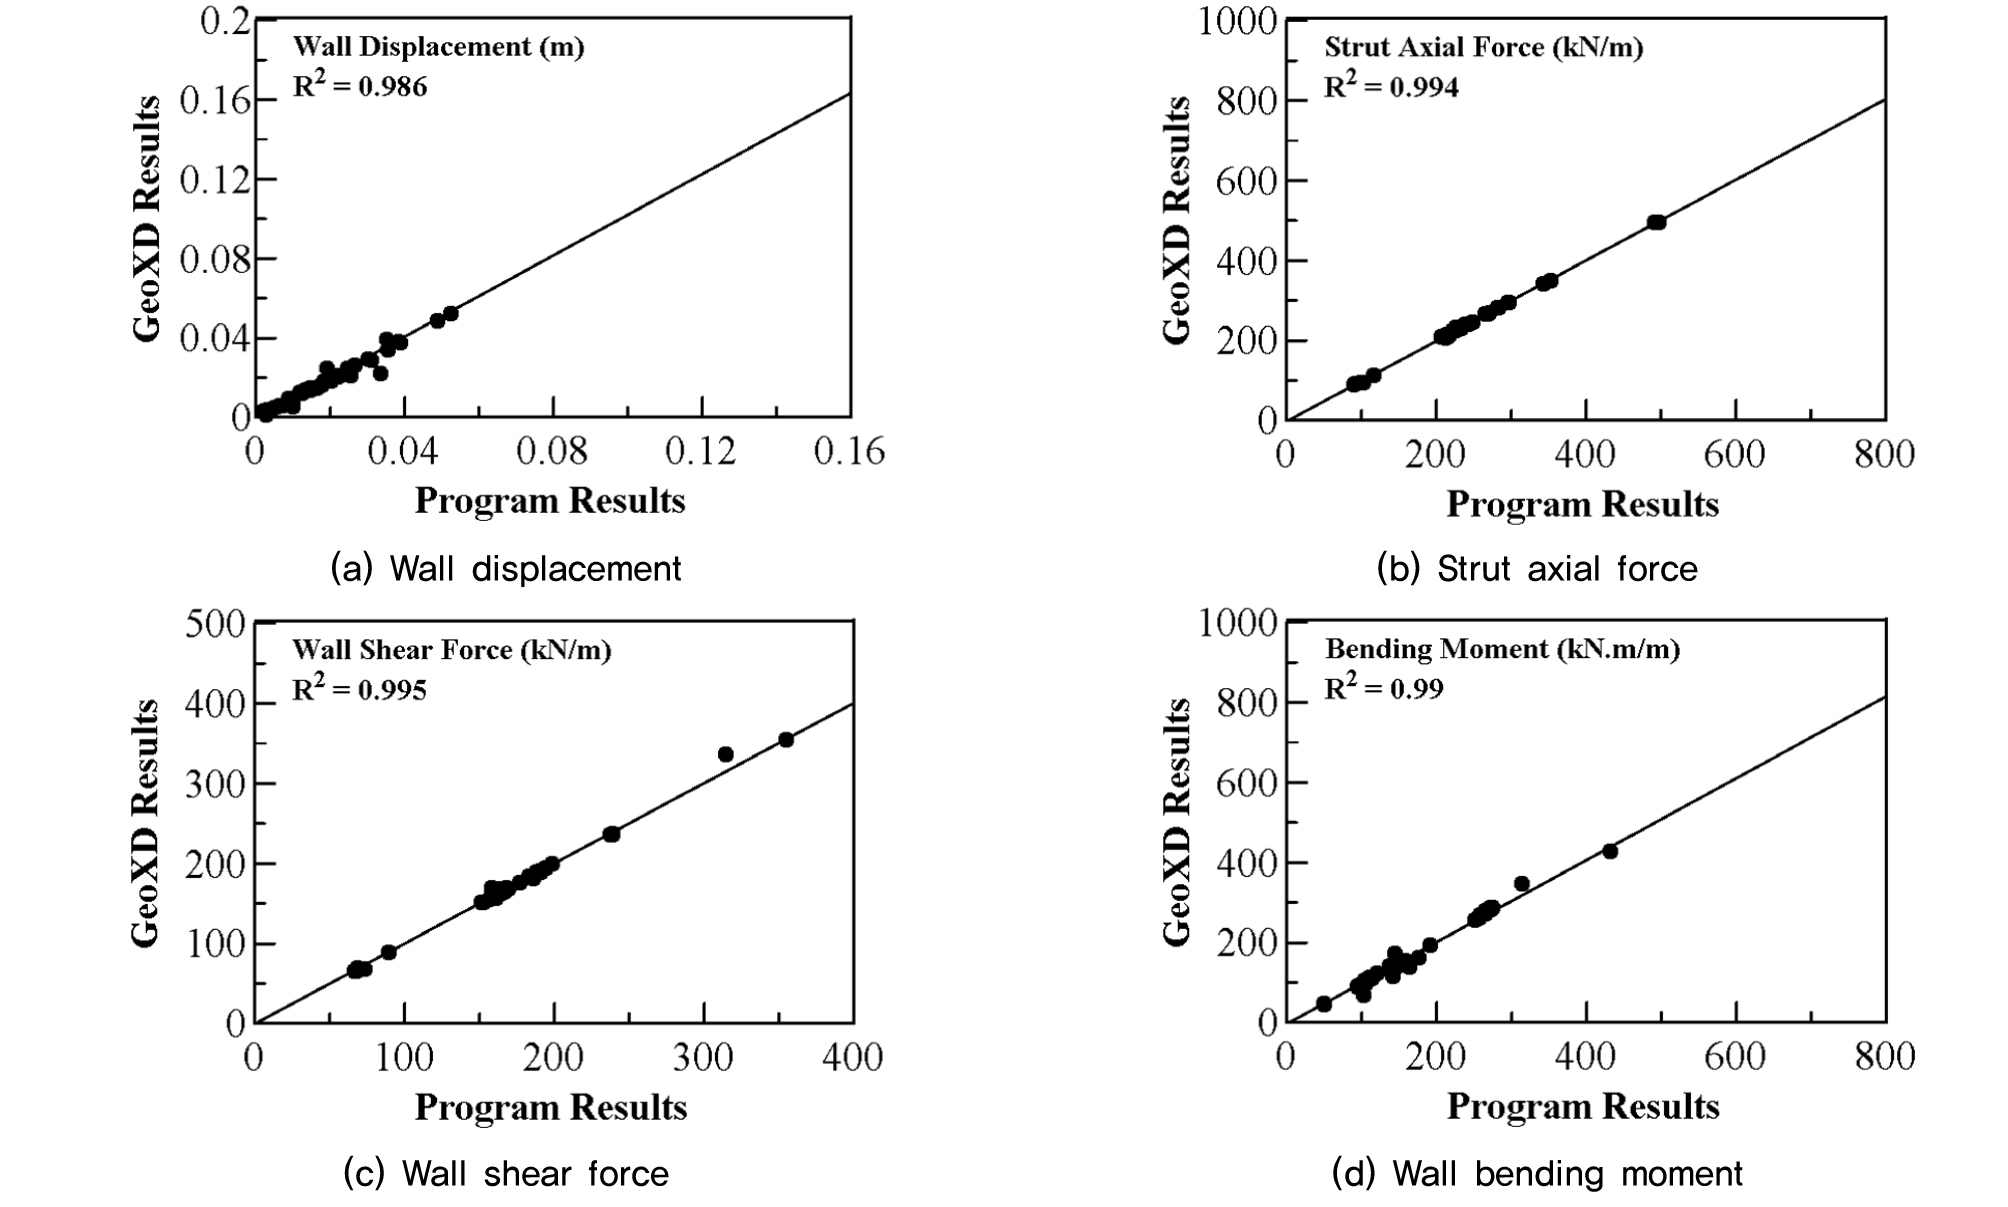
Fig. 13 shows the comparison results for wall & support sub module results with GeoXD datasets that are used to generate the ANN. R2 values for wall disp., Strut axial force, Wall shear force and Wall bending moment are 0.986, 0.994, 0.995 and 0.99 respectively. these results show that program calculations are OK.
5.2.4 Stability check results
Stability check results are presented in Table 14 and 15. Tables show the stability check results in comparison form for program predicted values against allowable values. To obtain allowable values for displacements and stresses, the standard design formulas for specified code practices in Korea are used and can be obtained from Korean construction design manuals. The approach for stability check is same as used in conventional designs, i.e. comparing calculated values for induced effects to the allowable values, the only difference is in this study and conventional design is use of ANN for the prediction of induced effects rather than using complex conventional formulas. Finally, program assigns OK or NG based on the passed or failed stability check results respectively.
Table 13. Stability check results for CIP and H-Pile Walls
Wall displacement stability check results are shown in Table 14 row 1. The predicted wall movements are compared with allowable movements to check the stability for the lateral wall movement. The allowable wall displacement is calculated as 0.2% of the excavation depth, which is a standard for deep excavation projects in Korea. For the current example 0.2% of 20 meters excavation depth is 0.04 meters. Both walls CIP and H-Pile wall passed the stability check, which means that these walls are stable against the displacement induced to excavation.
Wall shear stability check results are shown in Table 14 row 2. Applied wall shear stress was calculated from Eq. (4) for H-Pile and Eq. (5) for CIP wall. These calculated values are then compared to the allowable shear stress values. Allowable shear stress values for H-pile wall include only shear strength calculations for steel based selected sectional properties while for CIP allowable shear include shear strength calculations for steel reinforcements and concrete reinforcements.
| $$\tau\;=S_{\max\times\;(S_h\;)w}/A_{w\;}\lbrack MPa\rbrack$$ | (4) |
Where in Eq. (4), is Smax max. shear force induced due to excavation, this value is ANN predicted and obtained from the program, (Sh)w is horizontal spacing of H-Pile and is sectional area of wall panel. There are seven H-Pile sections that are used in the program. Each section has specific area. Sections details and sectional properties tables are taken from Hyundai steel product guide (KS, JIS 90), while horizontal spacing is an input given in Table 8.
| $$\tau=(S_\max\times d\times1000)/(b\times(b-t_c))\;\lbrack MPa\rbrack$$ | (5) |
Where, in Eq. (5) d is CIP wall column diameter, b is transformed sectional length and tc is cover thickness and these are user input parameters. Transformed length b is auto calculated in the program by using diameter of the wall, while cover thickness is an input that depends upon the shear reinforcement design of the CIP wall and 1000 is used as a unit conversion factor. Results against shear stability for each wall are OK, which shows that induced shear stresses are less than the allowable limits i.e. both of the walls are stable against shear stresses for the given case.
Strut axial stress stability check results are shown in Table 14 row 3. Eq. (6) is used to calculate the axial stresses induced in the strut members due to the axial forces generated by the excavation activity.
| $$\sigma_{(st,A)}=P_\max\times S_{h_{st}}\times1000/A\;\lbrack MPa\rbrack$$ | (6) |
Where, in Eq. (6) is the Pmax maximum strut axial force predicted by ANN, (Sh)st is strut horizontal spacing, which is user input value given in Table 7 and A is strut sectional area, that is automatically incorporated into the program when user selects a section from 4 available sections for strut. Sectional details and sectional properties for strut member sections are taken from Hyundai steel product guide (KS, JIS ‘90). While 1000 is a unit conversion factor. Results against strut axial stability for each wall are OK, which shows that induced axial stresses are less than the allowable limits i.e. strut support members for both walls are stable for the given problem.
Wall compressive bending stress stability check results are shown in Table 14 row 4. These bending stresses are generated by the bending moments produced in the wall and bending moment values are obtained from program through ANN prediction. Applied bending stresses for H-Pile and CIP walls are calculated using Eq. (7) and from Eq. (8) respectively.
| $$f_c=M_\max\times(S_h)_w\times1000000)/(Z_{(x})〖mm〗^3)\;\lbrack MPa\rbrack$$ | (7) |
| $$f_c=2\times M_\max\times d\times1000000)/(k\times j\times b\times(b-t_c)^2)\;\lbrack MPa\rbrack$$ | (8) |
Where in above Eq. (7) Mmax is maximum bending moment value from program based on ANN and (Sh)wall is horizontal spacing of H-Pile/Stiffener, which is a user input given in Table 9. is sectional modulus of the selected H-Pile section, this parameter is taken from the Hyundai steel product guide (KS, JIS ‘90).
Where in Eq. (8) Mmax is maximum bending moment value from program, based on ANN and other parameters are as follows;
| $$j=1-k/3$$ |
| $$k=\sqrt{((n\times\rho)^2+(2\times n\times\rho)-(n\times\rho))}$$ |
| $$\rho=A_s/(b\times(b-t_c))$$ |
Where, As is total sectional area of main reinforcement, n is 8, ratio of E between steel and concrete, moduli E for concrete and are fixed parameters for a given grade of steel and concrete, while the specific area against each item is taken from Korean standard steel manuals. Results show that applied compressive moments are within the allowable limits for both wall type. So, the reinforcements used in CIP are sufficient, while H-Pile section chosen is OK.
Wall bending tensile stress stability check results are shown in Table 14 row 5. The tensile bending stress is checked for CIP to ensure the stability of steel reinforcements against the bending moment. ANN calculated wall bending moment is used to calculate the applied wall bending tensile stress, fa from Eq. (9).
| $$f_s=(M_\max\times d\times1000000)/(A_s\times j\times(b-t_c))$$ | (9) |
Where, 1000000 is used as a unit conversion factor while other parameters are same as explained for Eq. (8). Stability results indicate that applied stresses are within the allowable limits hence steel reinforcements for CIP wall are sufficient, and the wall is stable for the given conditions.
Stability check results for SCW are presented in Table 15. The calculations for SCW are different from others because here only checked for the required design compressive strength against the active earth pressure imposed by backfill material. To calculate the design compressive strength for SCW, axial force and shear force generated due to the active earth pressure are calculated. Based on these forces minimum compressive strengths are calculated for wall design, to obtain safe value for design strengths minimum values of these strengths are multiplied by factor of safety of 3 and then maximum of the two values is chosen to be the required design compressive strength for SCW.
As factor of safety has been chosen as 3 so it can be assumed that the SCW wall for a design strength of 1.59 MPa for a single column is stable against the calculated earth pressures.
Table 15. Stability check results for SCW
| Parameter | Max. Value (kN) | Sc (MPa) | F.S | Req.Sc (MPa) | OK/NG |
| Axial force | 88.3 | 0.3 | 3 | 0.8 | NG |
| Shear force | 88.3 | 0.53 | 3 | 1.59 | OK |
6. Conclusions
This study presented the development and implementation of an ANN based deep excavation induced displacement, groundwater effect and wall and support forces prediction program (ANN-EXCAV). The program takes inputs and calculates the induced effects for the given wall and support member. Program also checks the stability of the support system by comparing applied stresses calculated using predicted values to the standard allowable values. An example case is demonstrated in section 5. From the results it is concluded that
∙ Within the limitations of ANNs, program can calculate effects induced due to deep excavation activity without performing any complex and time- consuming calculations.
∙ Based on the stability check option user can decide about the safety of the selected wall and support member against the given conditions.
∙ As can be seen in the graphs provided in validation section, program can predict the induced paramteres similar to the results of analyses programs such as Plaxis, GeoXD and SeepW, while preforming no complex calculations.
∙ the main limitation of the program is the range of input values within which the ANNs are trained, anything beyond those ranges can results false values.
∙ To overcome the above mentioned limitation a larger range of input should be included in ANN training, which means that more analyses data is required to prepare Database for the ANN training.
∙ Further validation is required for this program is required to actually use it in the field, for this purpose real world deep excavation case histories can be used to create a database that can be used to train a new set of ANNs or simply program results can be compared with the proven case histories.
∙ currently, program is only limited to one type of support member i.e. strut. later anchor can also be added to the support section.
