

1. Introduction
2. Ai-based Tunnelling Impact Assessment
2.1 General overview
2.2 ANN based prediction
2.3 Building and Pipeline damage assessment
3. Development of Skku-itunnel (Tunnel)
3.1 Program platform and structure
3.2 Input module
3.3 Settlement & Groundwater module
3.4 Building & Pipeline assessment module
4. Program Evaluation Using Field Data
4.1 Example problem description
4.2 Evaluation results
5. Conclusions
1. 서 론
Rapid growth in population and urbanisation in current era have increased the use of underground space for transportation systems and utilities. Tunnelling has been used as a first choice to create the underground spaces to accommodate the transportation and utility networks. While tunnel construction activities get underway, state of the stresses around the tunnel changes, also loss of the ground around the tunnel occurs. These induced effects appear on the ground surface as ground surface settlement, that may cause strains onto buildings/utilities in the vicinity of the affected area dubbed as rotation, distortion and possibly damage. So, it has become a standard practice to make settlement predictions and damage assessments prior to starting construction of tunnel.
Conventionally, prediction of tunnelling induced settlements during initial design process is done using procedure outlined by Peck (1969) and O’Reilly and New (1982) and extended by New and O’Reilly (1991). Then this predicted settlement is used to assess the possible damage to buildings and utilities in the vicinity using simplified approaches suggested by (Boscardin and Cording, 1987; Burland, 1995), Burland and Worth (1974), Bracegirdle et al. (1996) and Yoo and Kim (2003).
As the procedure described above requires considerable amount of time and computational effort since the current tunnelling environment involves a large number of building and utilities therefore an efficient computer-based prediction and assessment system better serves the purpose. To further reduce the computational time artificial neural network (ANN) can be used to predict the maximum surface settlement, which in turn can be used to calculate surface and lateral movements at given extents, trained by using databases developed from field data and numerical analysis technique Yoo et al. (2018). There have been many studies reported with similar approach of utilising information technology (IT), such as artificial intelligence (AI) and programming language (C++, C#, VB) to develop automated prediction and visualisation systems for example Yoo et. al. (2010) developed an ANN based underground excavation design system that coupled the ANN technique and numerical analysis for design and planning of underground structures. Yoo and Kim (2003) and developed IT/web-based tunnelling risk management system that used AI-approach to predict settlements and visualise in GIS environment. Netzel and Kallberg (1999) developed a GIS-based settlement risk analysis system. While the described studies used same approach, the current study differs from the rest as it includes a standalone system that is independent of web or GIS environment and uses its indigenous database to analyse multiple sections of a tunnel project. Moreover, the introduction of optimum design module enables the users to modify support pattern as per the requirements of safe tunnelling activity.
This paper presents the development and implementation of an AI-based tunnelling induced impact assessment program, that aims to provide a user-friendly platform to reduce the cumbersome and time-consuming calculation effort put to predict tunnel induced settlements and finally compute the building and utility damage assessment. To achieve the aimed goal, real field data coupled with numerical analysis data for different tunnelling cases was arranged into a well-defined database, further divided into datasets to train the ANNs for settlement and drawdown predictions and incorporated in the program using C# programming language and graphical user interface (GUI) is developed to assign inputs and calculate results. By utilising theses predicted settlement values building and pipeline damage assessments are done using simplified formulas. The following sections present the details of ANN development, system structure and finally, the validity of current study.
2. Ai-based Tunnelling Impact Assessment
2.1 General overview
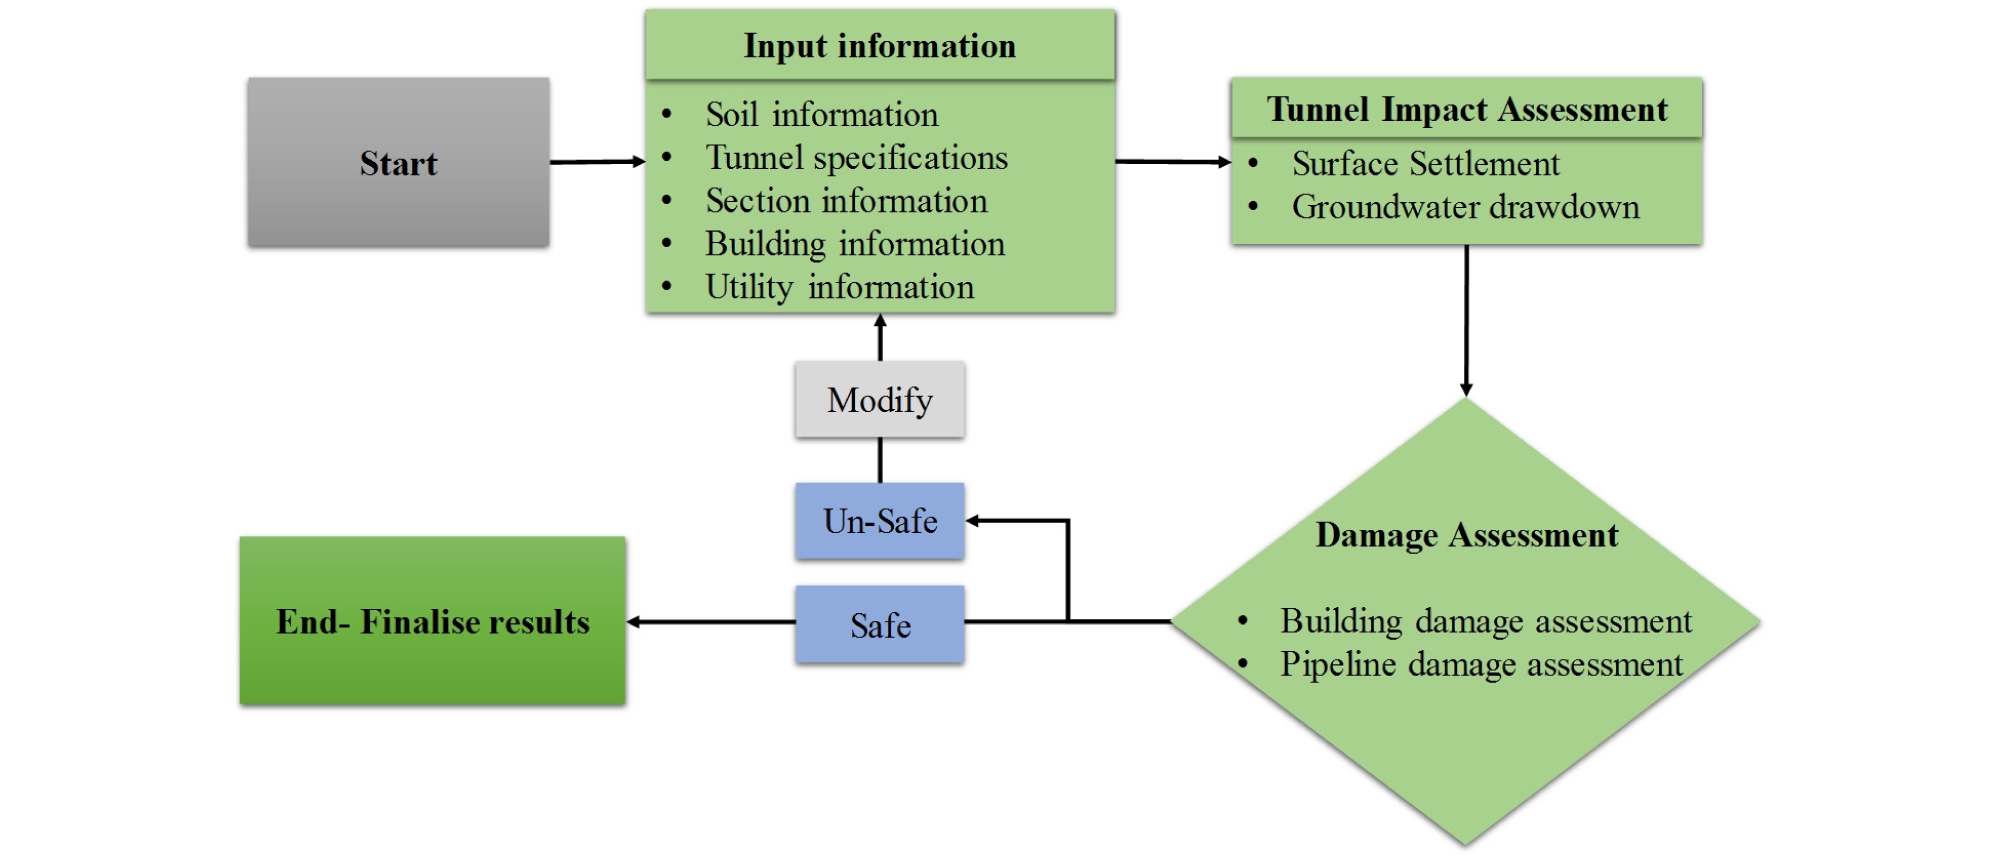
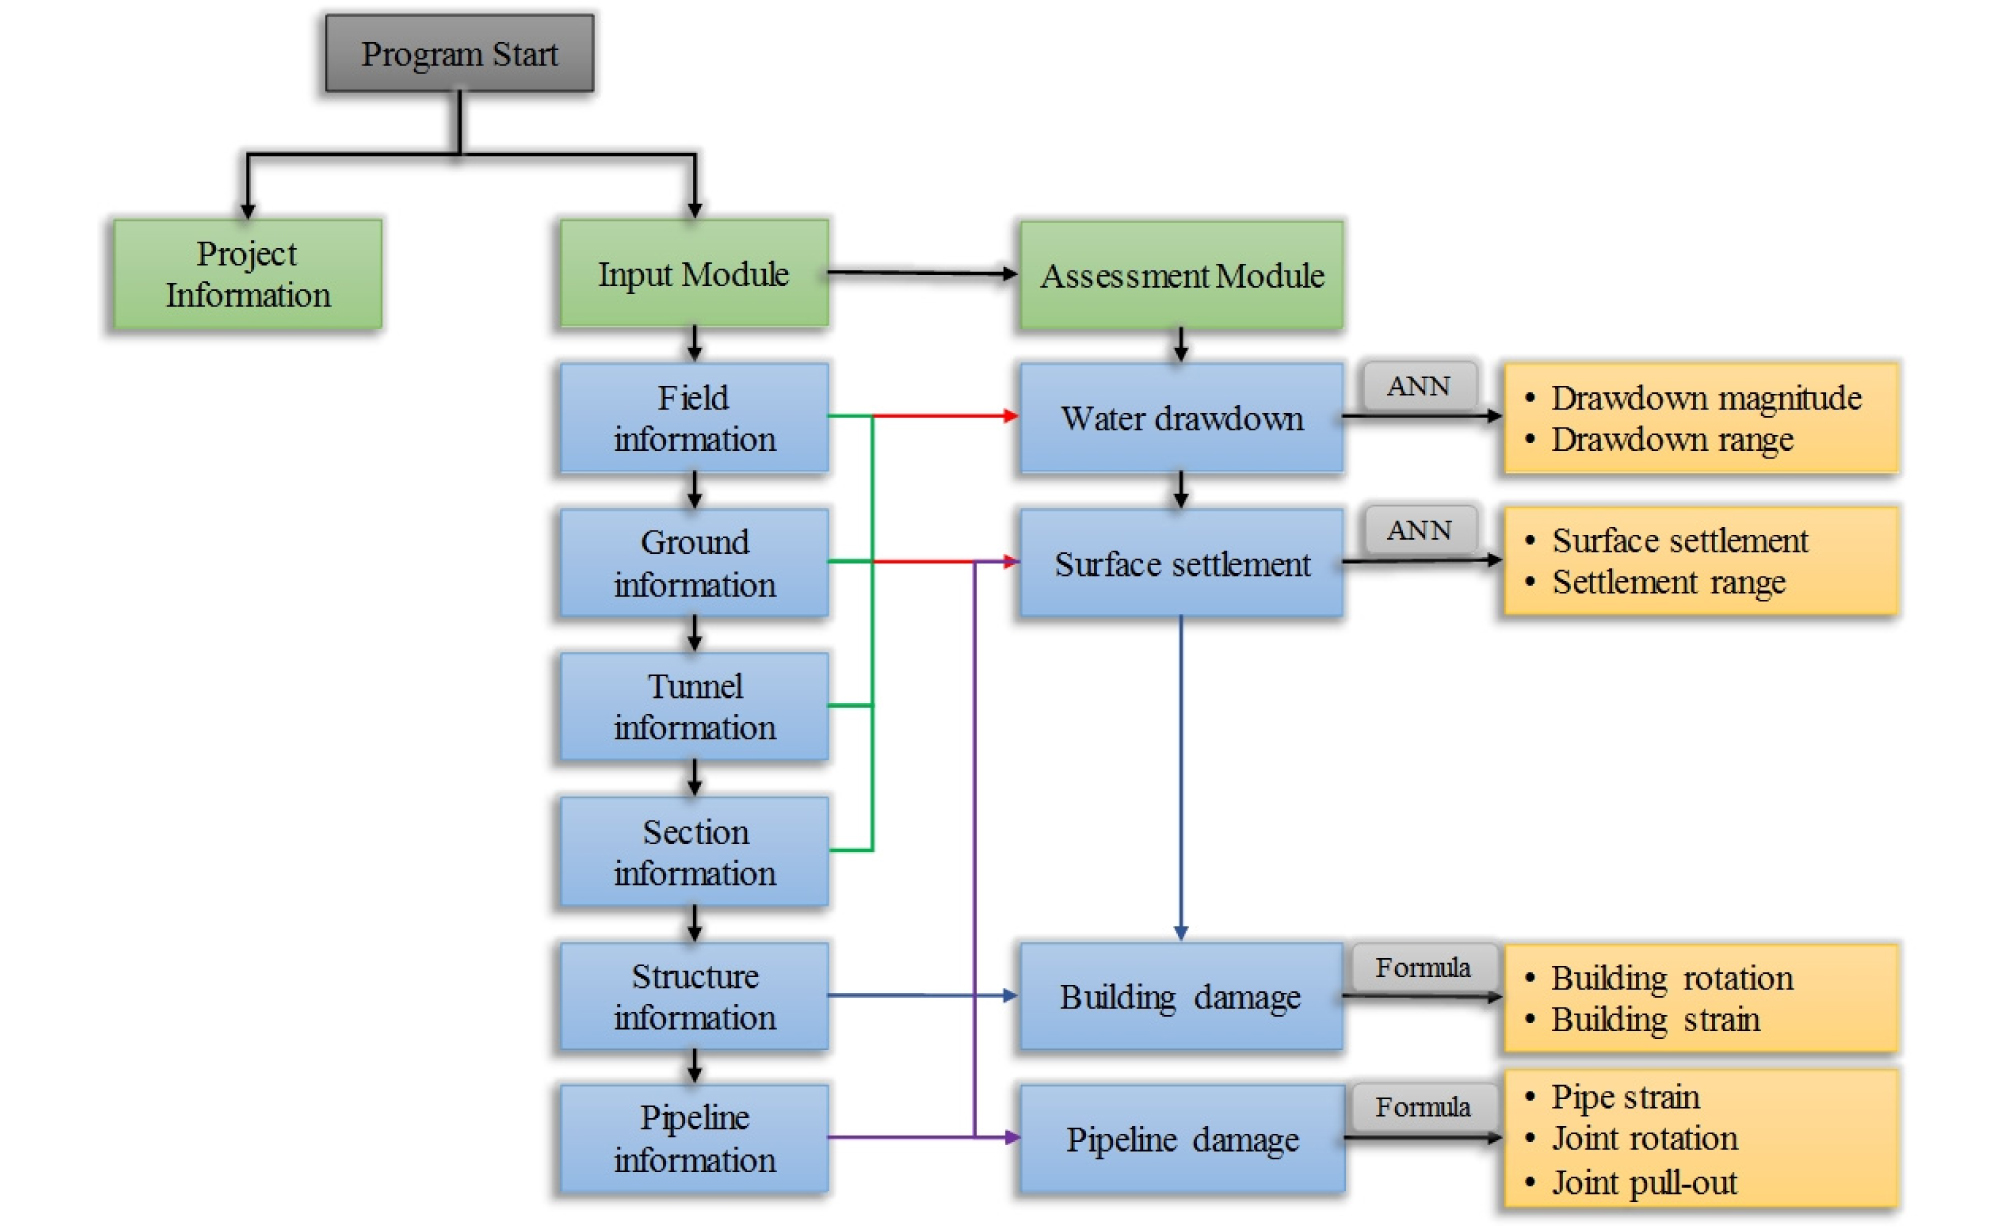
As the tunnel is excavated in the subsurface, its impact in the form of surface settlement and groundwater drawdown can be monitored. High volume loss due to tunnelling causes larger surface settlement and large amount of water rushes towards the excavated area hence greater drawdown can be observed. This primary impact of tunnelling on ground surface and ground water affects the buildings and utilities in the vicinity. These effects may cause damage in the buildings and utilities. The possible damage assessment is done under the tunnelling impact assessment by utilising the artificial intelligence technique. The logic behind program development is shown in Fig. 1. Using an interactive GUI input information is fed to the program for multiple sections and stored in a database to be used as an input to the incorporated ANN for the prediction of settlement and groundwater drawdown induced to the tunnel that is being analysed. This predicted settlement value is use in implemented formulas to calculate the degree of damage in nearby buildings or utility networks caused by the predicted settlement. An assessment is made for the calculated degree of damage by comparing it with standard allowable values for a safety check, if the assessments are in unsafe category analysis can be repeated by modifying the input parameters otherwise the results are accepted as safe.
2.2 ANN based prediction
Generalised ANN (Fig. 2) using the results of numerical analysis can make tunnelling performance related predictions with comparable degree of accuracy to that of numerical analysis method as reported by Yoo and Kim (2007). Adequately trained ANN can reduce the computational burden subsequently. In order to train an ANN, the real field cases are needed to prepare a dataset that is further analysed through numerical analysis program to generate the databases. For current study, real field cases and carefully prepared tunnelling cases for groundwater drawdown and surface settlement, that represented the real field conditions, were analysed and modelled by using ABAQUS (Dassault Systèmes®, 2018) and GeoXD (MIDAS, 2011) respectively to generate the databases. These databases were then used to train the ANNs using MATLAB (MathWorks, INC). Datasets prepared were assigned as 75% for training, 15% for validation and 10% for testing the ANNs.
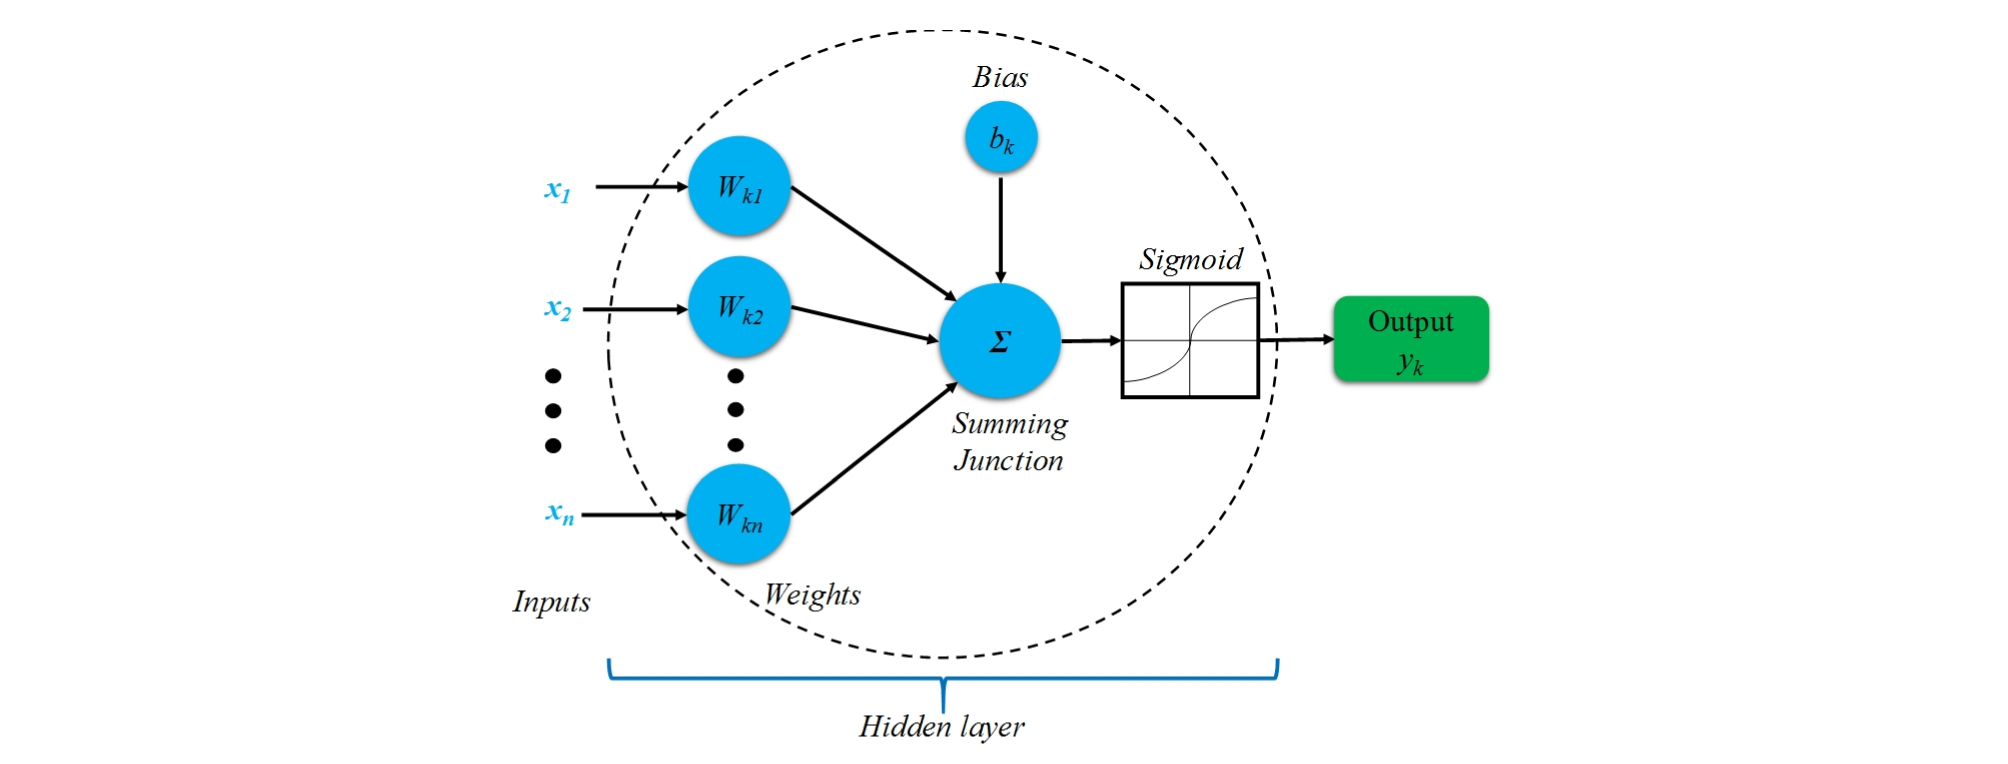
Translation of trained ANNs into the program was done by coding the sigmoid function Eq. (1).
| $$t_n=1+f_2\left\{W_2\times f_1(W_1(1-abs(2\times(p_n-1)+b_1)+b_2\right\}/2$$ | (1) |
Where in Eq. (1), tn is target output value, pn is normalized input value, W1~W2 are weights for hidden and output layers respectively, b1~b2 are bias for hidden and output layers respectively, f1 is the logsigmoid function, which is the activation function of hidden layer and normalizes the input to -1 or 1, given by Eq. (2), where f2 is tansigmoid function or a transition function as given in Eq. (3)
| $$f_1=f_3=logsig(n)=\frac1{1+exp\times(-n)}$$ | (2) |
| $$f_2=tan\;sig(n)=\frac2{1+exp\times(-2n)}-1$$ | (3) |
Where in Eq. (2), n = normalised output of Eq. (3), while in Eq. (3), n = normalised output of central part of Eq. (1). In program Eq. (1) is replicated by C# code in the form of a complex matrix calculation class. This class takes input from user, normalise it, apply Eq. (1) matrix to calculate output and finally deformalize the output to show the final value to the user.
Database for ANN training was developed by combining field data and numerical analysis data using ABAQUS. Cases developed for database preparation resembles the real field examples. 216 cases for the tunnel ground settlement were analyzed to develop the database. 70% of the datasets were used for ANN training, while 30% of the datasets were used for testing and validation 15% each, details of which can be found in Yoo et. al. (2019). Ground sample was considered to be a composite of soil and rock layers. Input parameters for the database development area shown in Table 1, while the input ranges are given in Table 2.
Table 1. General input used in ANNs training
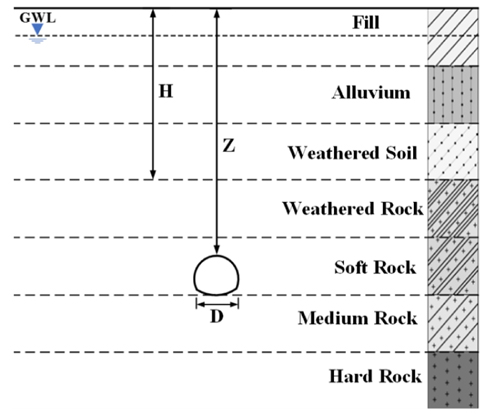
Table 2. Data ranges for Settlement & Drawdown DB
| Data range | D (m) | Z (m) | H (m) | e | Es (MPa) | Ks (cm/s) | ER (MPa) | Ksc (cm/s) | KR (cm/s) |
| Minimum | 10 | 15.6 | 0 | 0.7 | 20 | 0.00027 | 100 | 0.0000002 | 0.0000003 |
| Maximum | 18.9 | 70 | 30 | 1.4 | 70 | 0.0058 | 10250 | 0.00002 | 0.00062 |
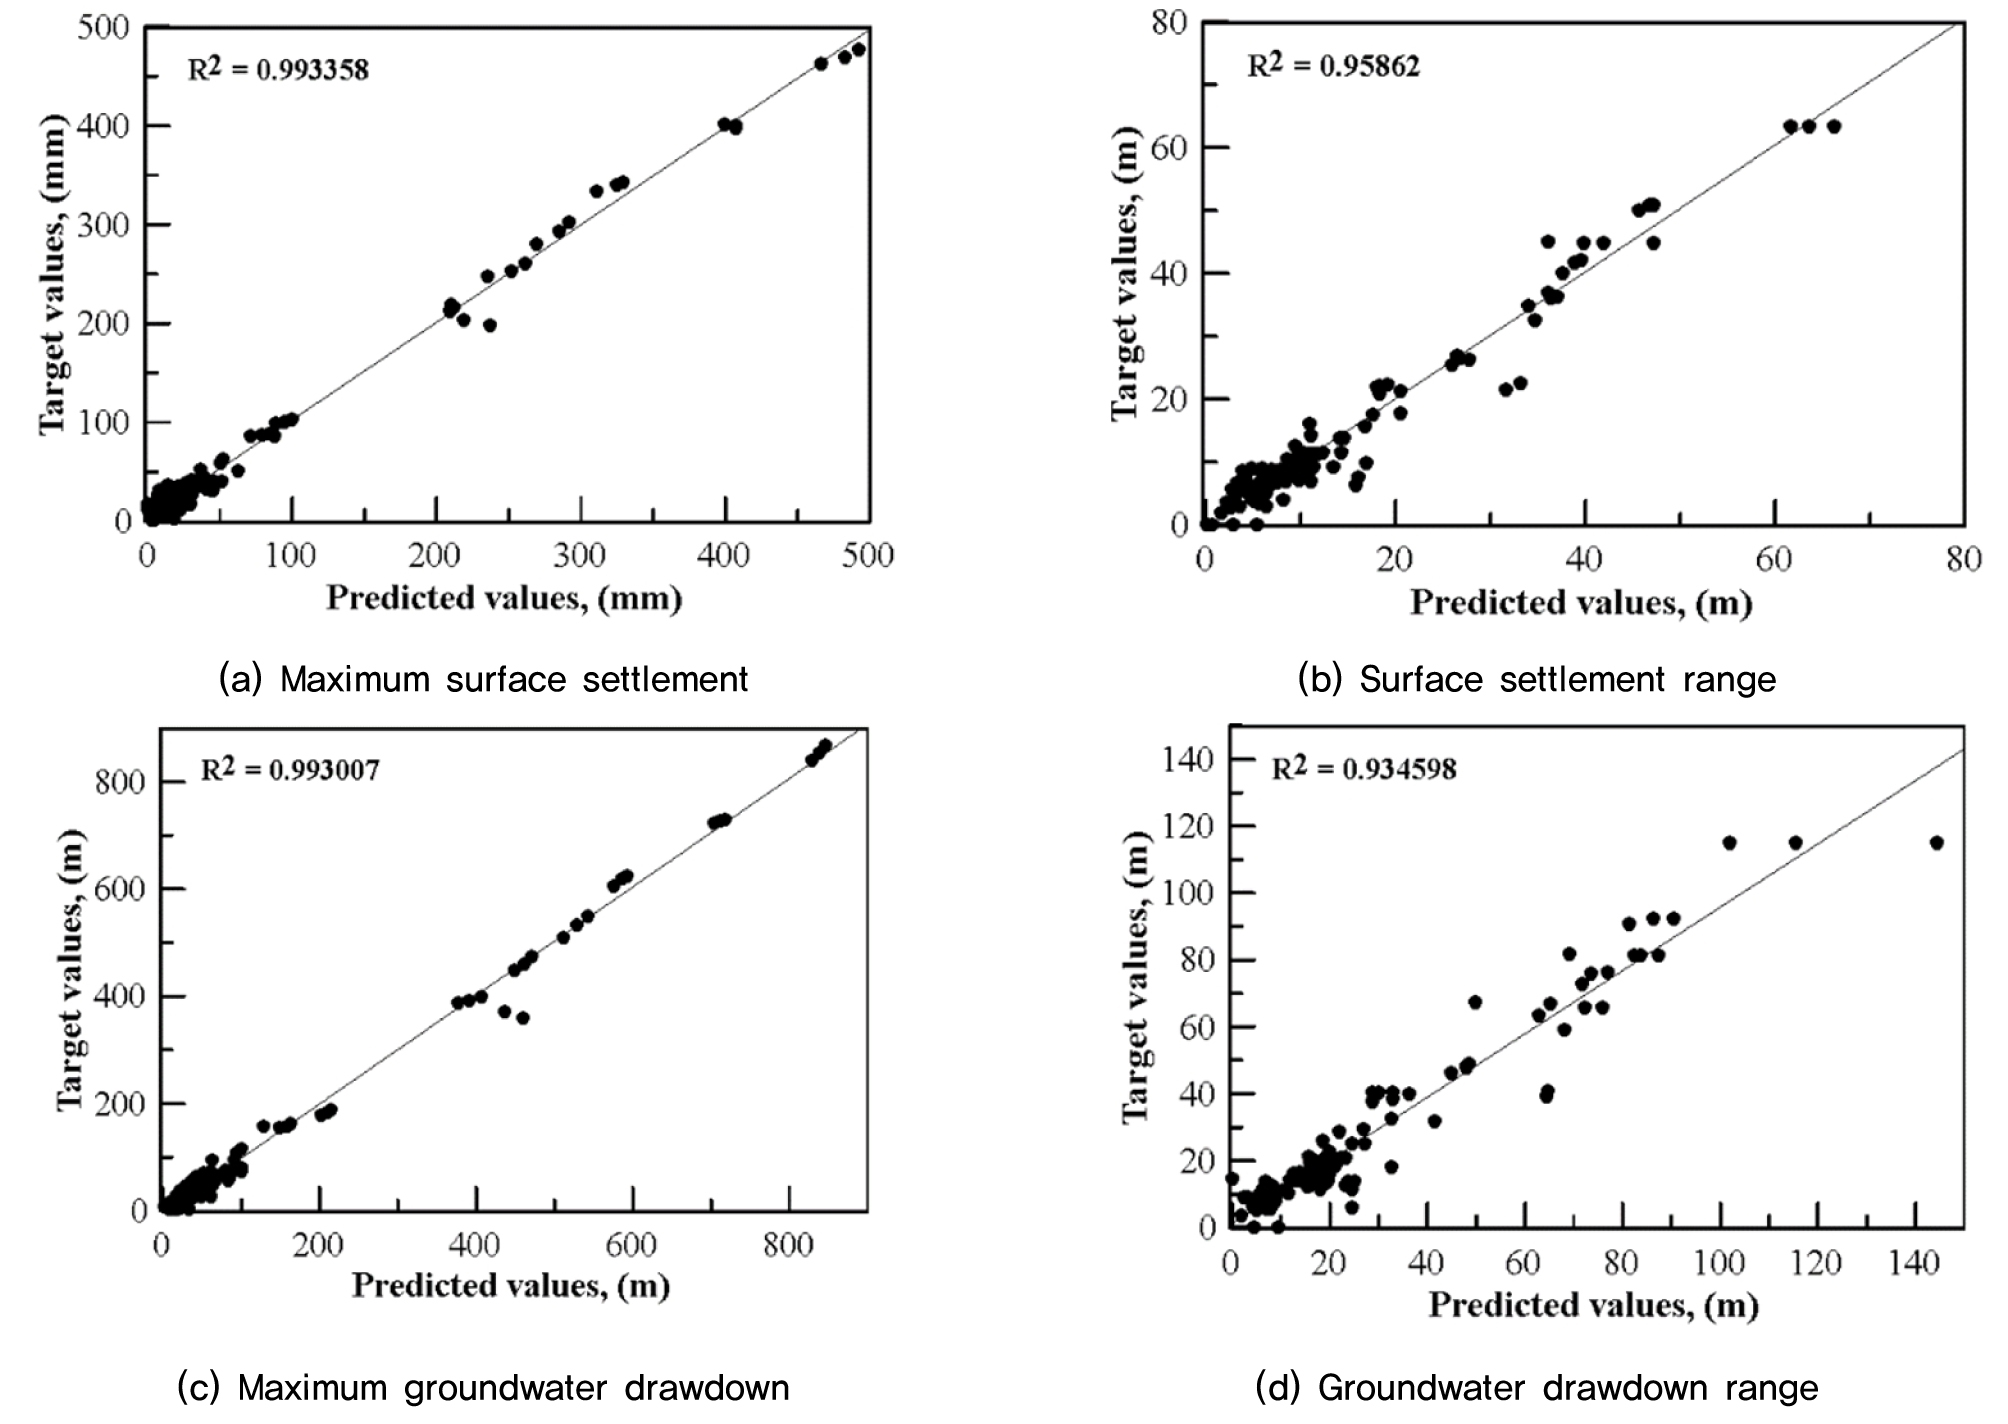
Input parameters for settlement prediction and groundwater drawdown through ANN are given in Table 2. The output parameters for settlement module are Maximum surface settlement (mm) & Range of surface settlement (m) with R2 values of 0.99 and 0.958 respectively, while the output parameters for groundwater module are Maximum groundwater drawdown (m) and Groundwater drawdown range (m) with R2 values of 0.99 and 0.935 respectively as shown in Fig. 3.
2.3 Building and Pipeline damage assessment
2.3.1 Building damage assessment
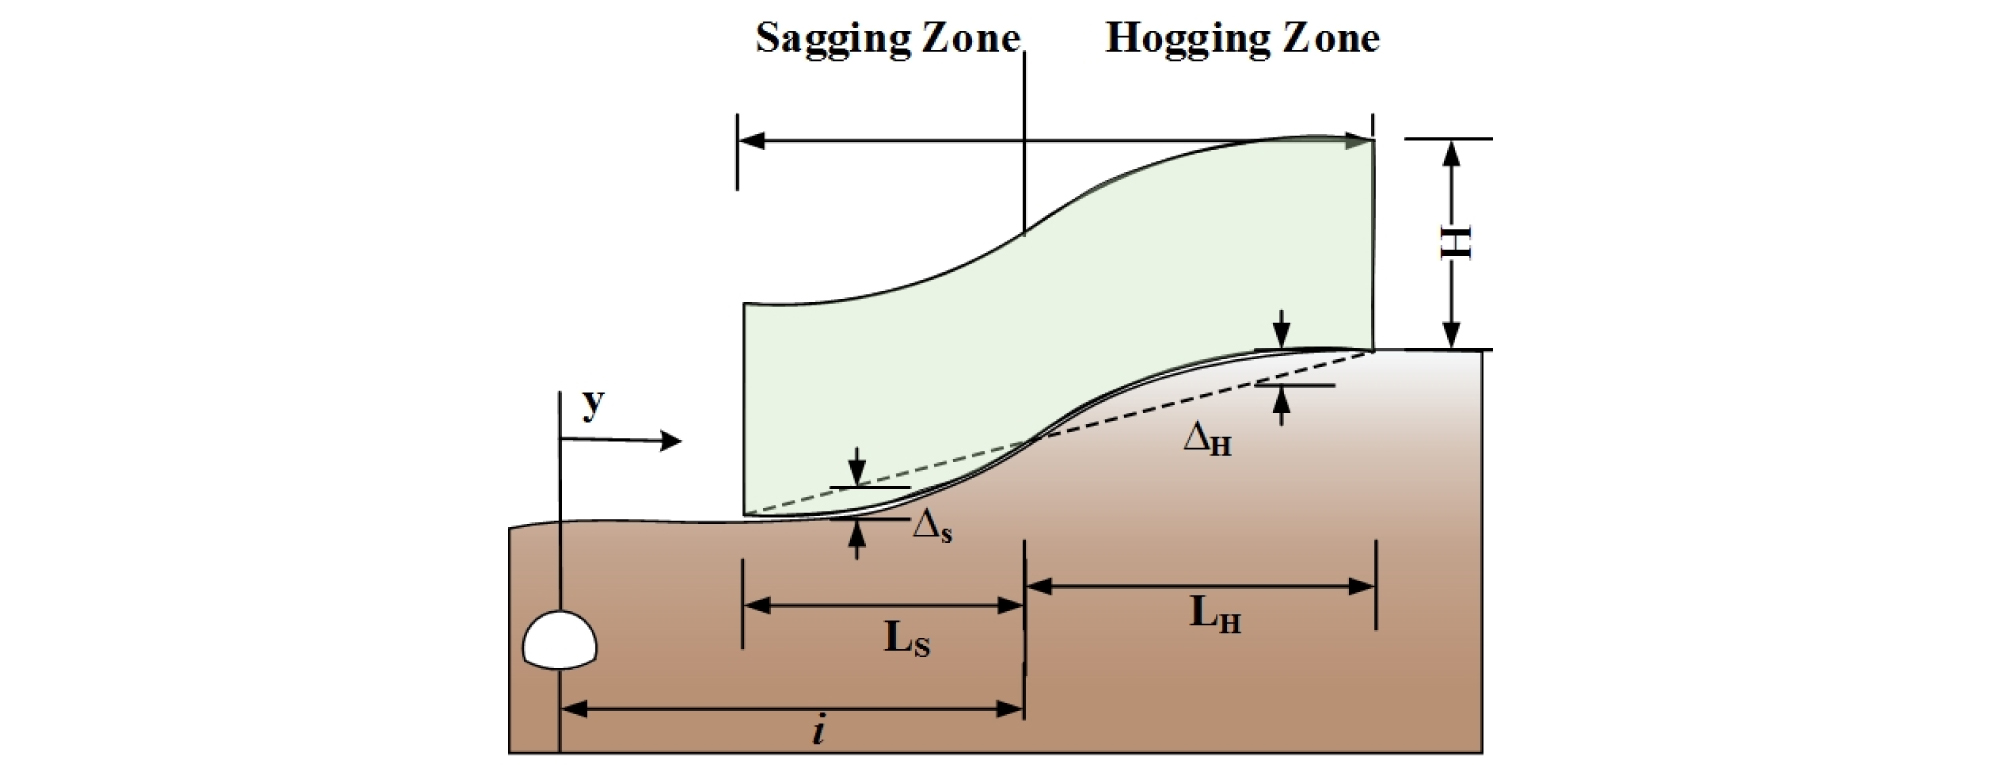
First order building damage assessment procedure proposed by Burland and Wroth(1974), was implemented in SKKU-Tunnel, in which building is treated as an idealized deep beam with a span L and height H deforming under a central point. Bending strain and shear strain produced in the building are calculated by equations 4 and 5 respectively, by assuming the building as a deep beam with span L.
| $$\frac\triangle L=\left[\frac L{12t}\;+\frac{3IE}{2tLHG}\right]\rbrack\varepsilon_b$$ | (4) |
| $$\frac\triangle L=\left[1\;+\frac{HL^2G}{18IE\;}\right]\varepsilon_d$$ | (5) |
Where, Δ is maximum deflection in the building, H is height of the building, L is length of the building, E is young’s modulus and G is shear modulus of the building, I is 2nd moment of inertia of equivalent beam and t is the furthest distance from the neutral axis to the edge of the beam ( for sagging zone and H for hogging zone). for masonry structures is taken as 2.6, while for steel frame structures is taken as 12. Fig. 4 shows a typical example of a building subjected to deformation due to tunnelling induced surface settlement. More details can be found in Yoo and Kim (2003).
2.3.2 Pipeline damage assessment
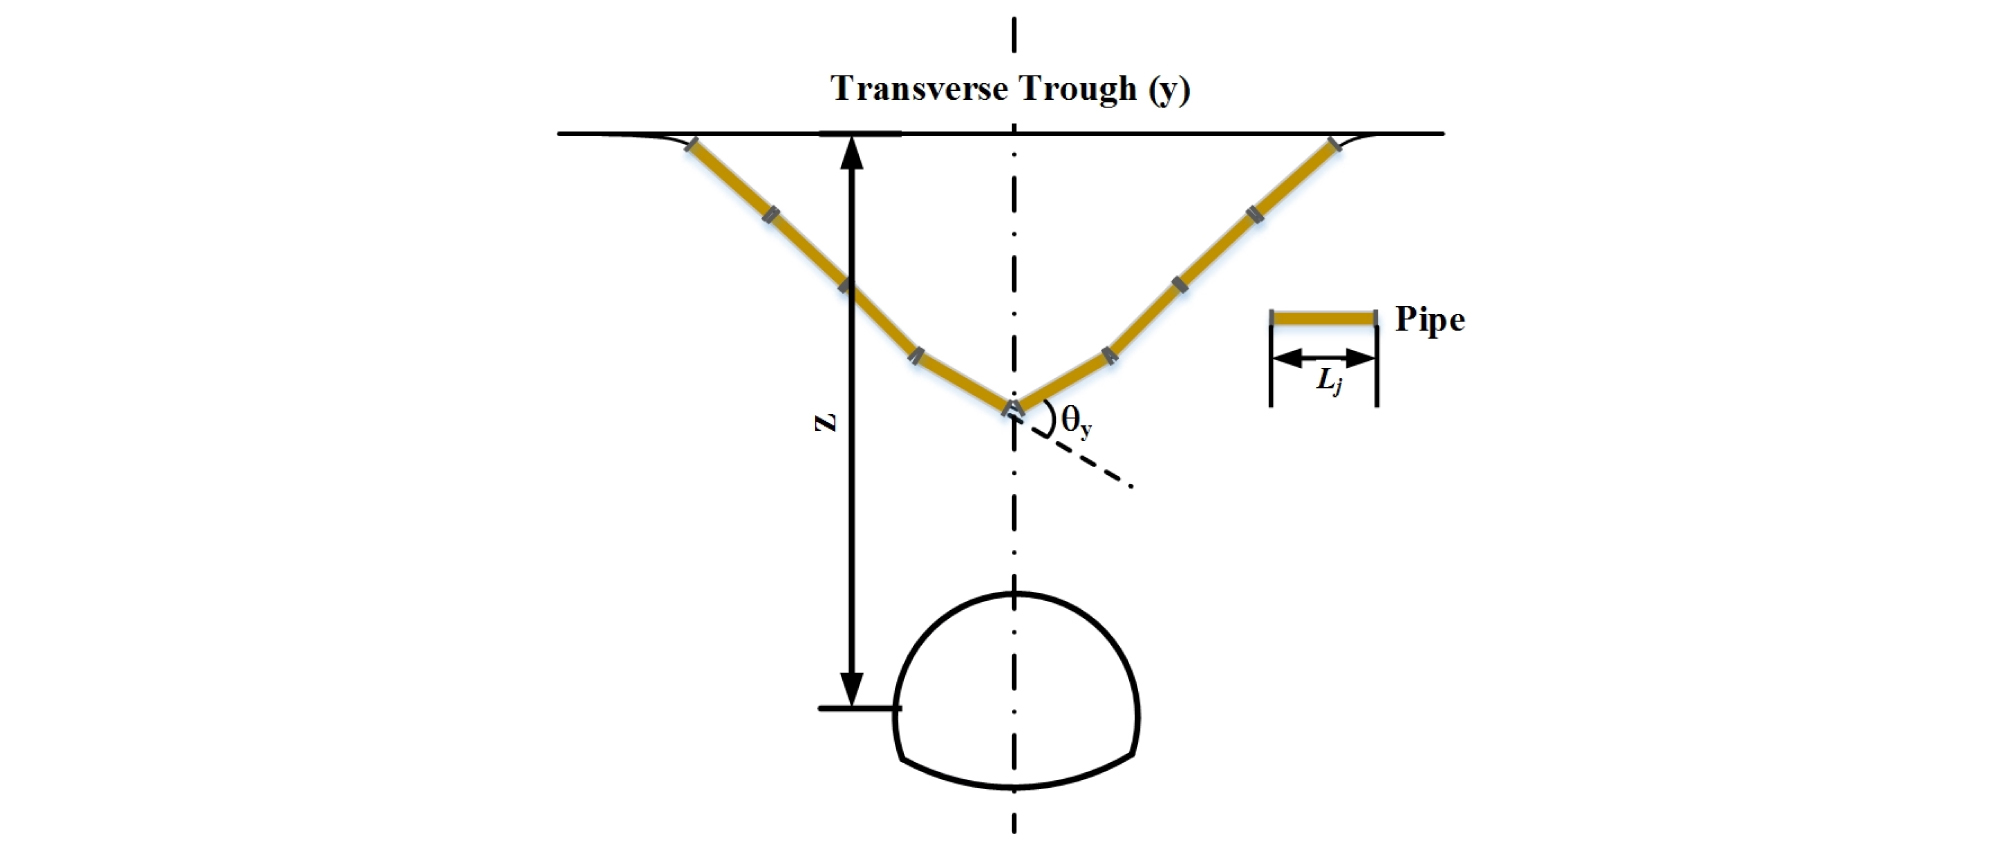
Pipeline damage assessment was implemented by adopting the simplified procedure proposed by Bracegirdle et. al. (1996) and recently extended by Yoo (2001). Joint rotation (θy) and joint pull-out (Ry) for pipes transverse to the tunnel axis can be compute by using Eq. (6) and (7) respectively, bending and diagonal strain formulas are used.
| $$\theta_y=2tan^{-1}\left[\frac{V_s}{2\pi i^2}\right]$$ | (6) |
| $$R_y=\left[\frac{0.242Vs}{Z_o-Z}\right]\;\left\{1-1.65\;\left[1+\frac{L_j}i\right]\times exp-\left[-1/2\left(1+\frac{L_j}i\right)^2\right]\;\right\}$$ | (7) |
Where Lj is individual pipe segment Length, Zo is depth of the tunnel, i is inflection point while Vs is volume loss due to surface settlement.
Pipe strains for transverse pipes can be computed by Eq. (8).
| $$\varepsilon_{ty}=\varepsilon_{by}+\varepsilon_{ay}$$ | (8) |
| $$\varepsilon_{by}=0.089\left[\frac{V_sd}{i^3}\right]$$ | (8a) |
| $$\varepsilon_{ay}=RF\left[\frac{0.178V_s}{Z_o-Z}\right]$$ | (8b) |
Where, RF is the pipe area ratio in which Ap and rp are the pipe sectional area and radius, respectively. Details of the procedure can be found in Yoo and Kim (2003). A typical schematic pipeline diagram is shown in Fig. 5.
3. Development of Skku-itunnel (Tunnel)
3.1 Program platform and structure
Program was developed in Microsoft Visual C# environment that was compiled using Microsoft Visual Studio 2017. To run the program, the required configuration must be at least Microsoft Windows 7 OS with an updated v4.5 .Net Framework having screen resolution of at least 1600 × 900. Structure of the program is developed as to design a convenient and simple GUI for the user, multiple modules were created to contain specific information and resulting values. As shown in Fig. 6, the program has three modules, a general project information module, input module and assessment module. Description of the program structure and development is given in the sections below.
3.2 Input module
Input module is basically a data entry page where multiple tabs are present for all input sections such as section division, field information, ground properties, tunnel specifications, structure information and pipeline information as shown in Fig. 7. Number of sections are defined at the start in the project information, while all other inputs are entered section wise in respective input dialogues. When all input information is completed, calculations and assessments are performed by clicking the button at the bottom of the page.
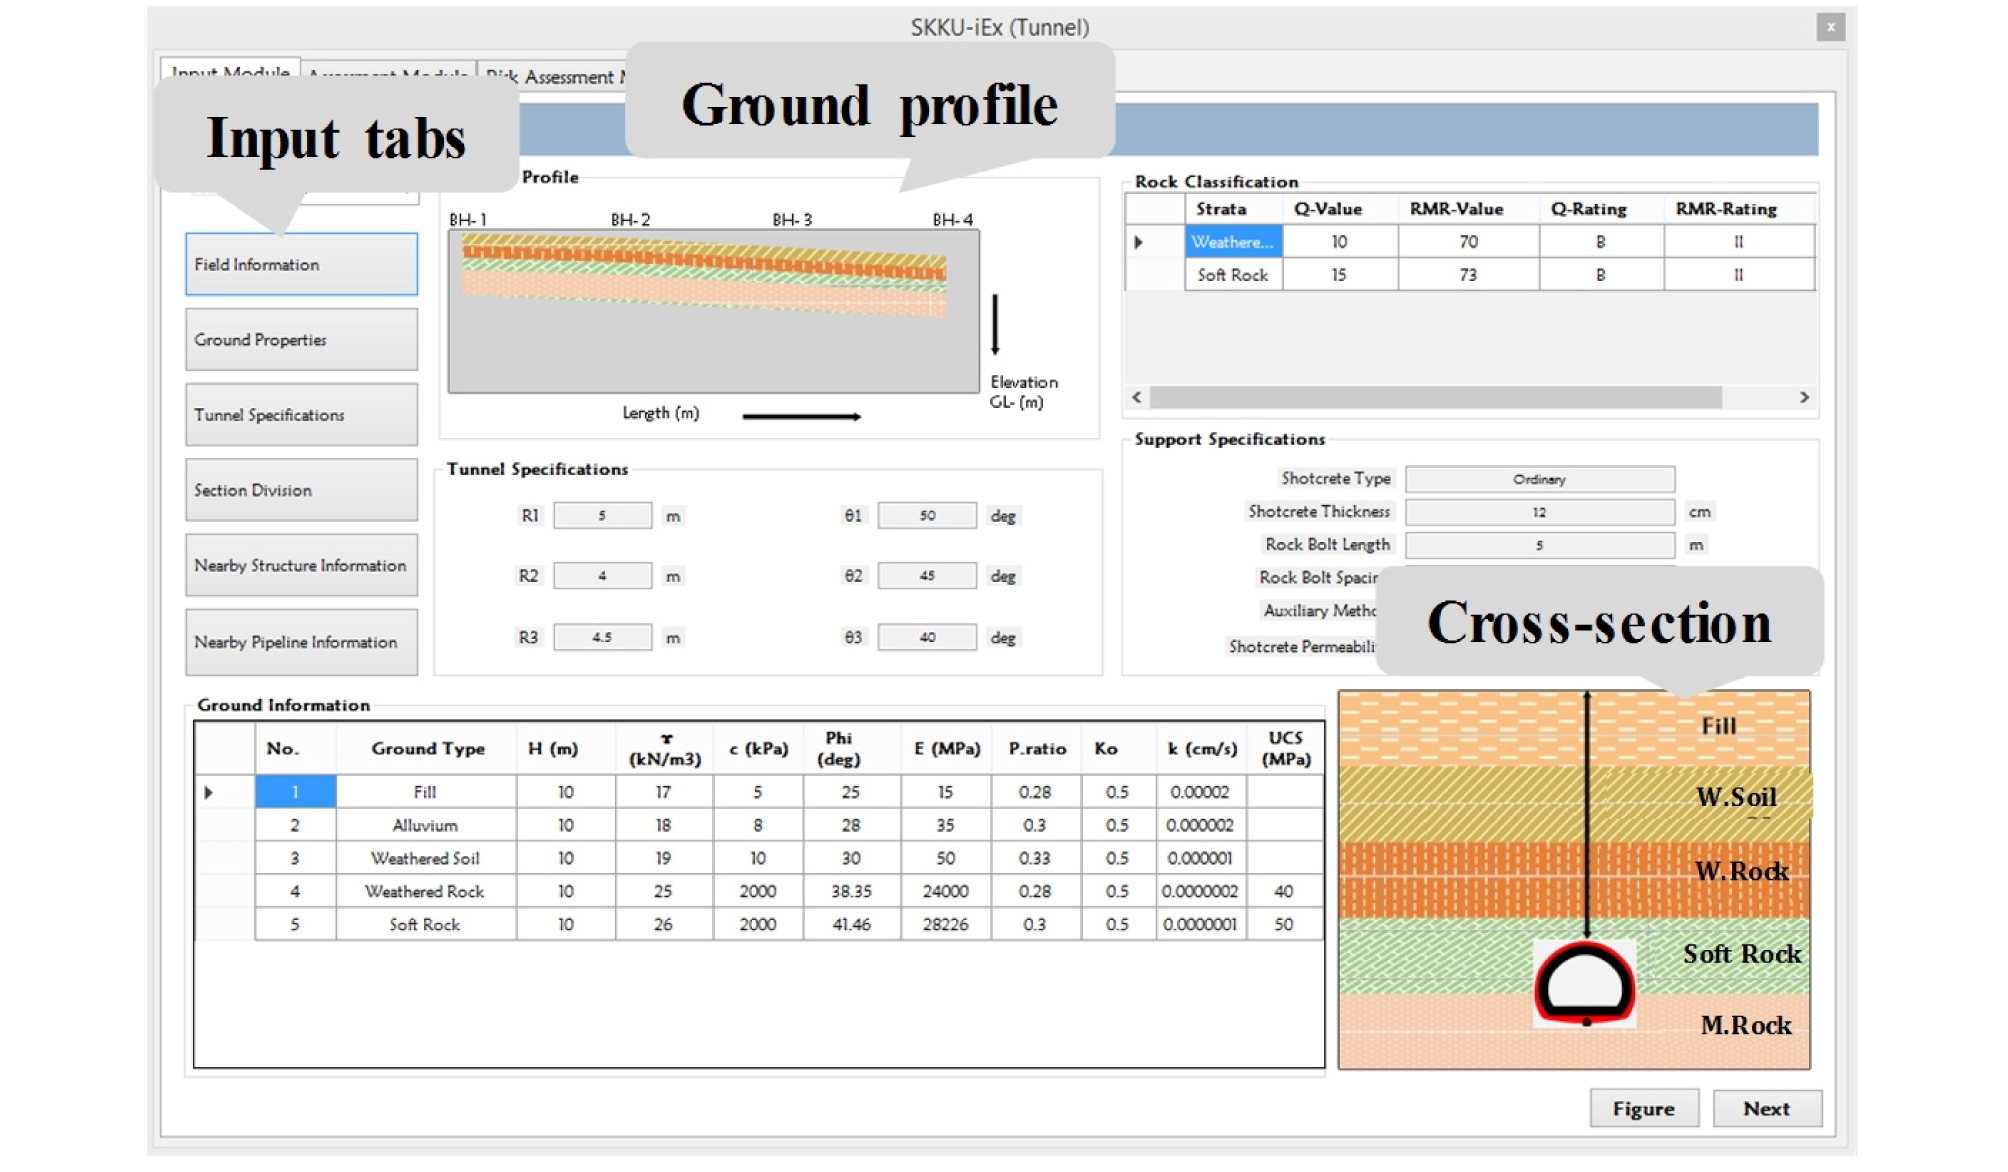
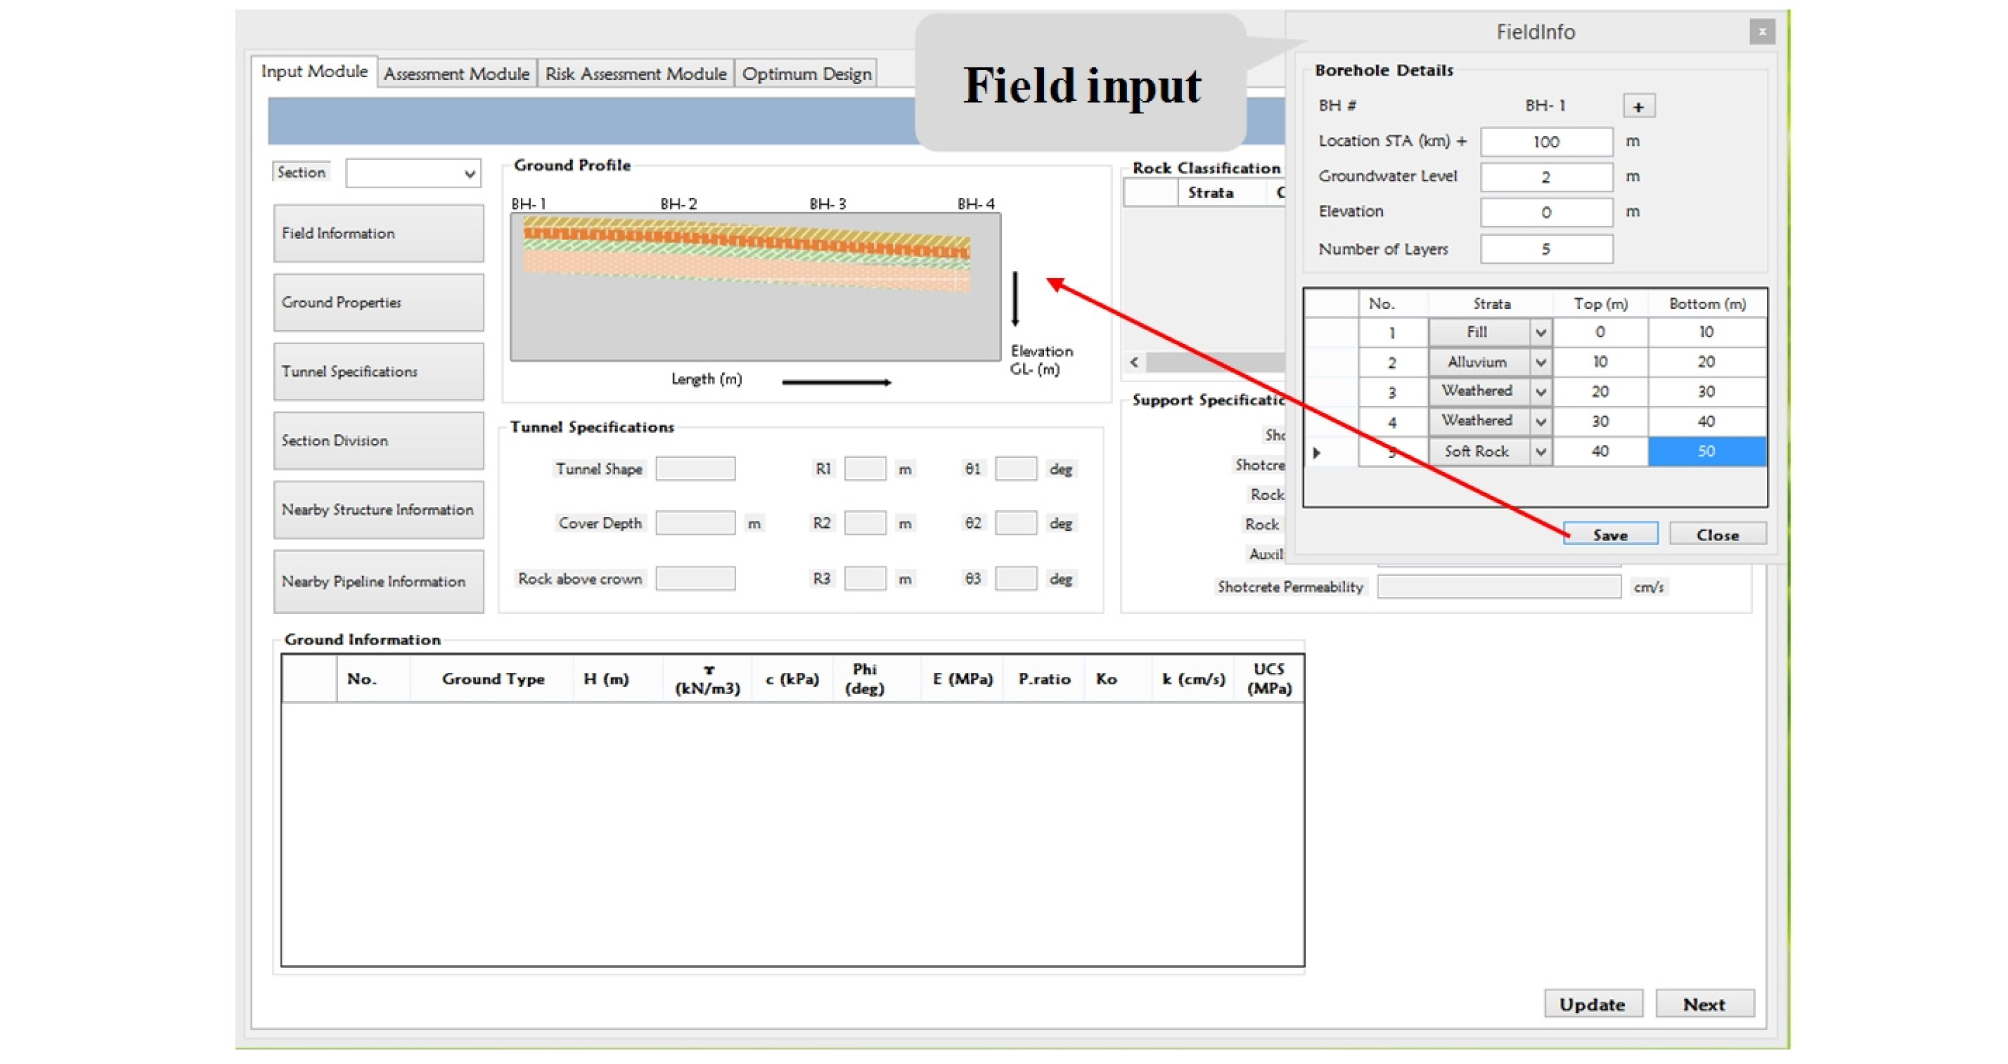
Field information contains borehole information for the total run of the tunnel. In field input dialogue borehole name, depth from the surface and number of layers along with top and bottom of the layers are assigned, and all this information is used to update the ground profile as shown in Fig. 8, while the thickness of the layers is calculated based on tope and bottom of the layers.
Number of ground layers are automatically added based on borehole data according to the maximum number of layers entered. Properties of soil and rock layers are added separately to accommodate the different material properties of soil and rock layers, while these properties are updated on the main page and rock classification table is filled according to the rock layer inputs as shown in Fig. 9.
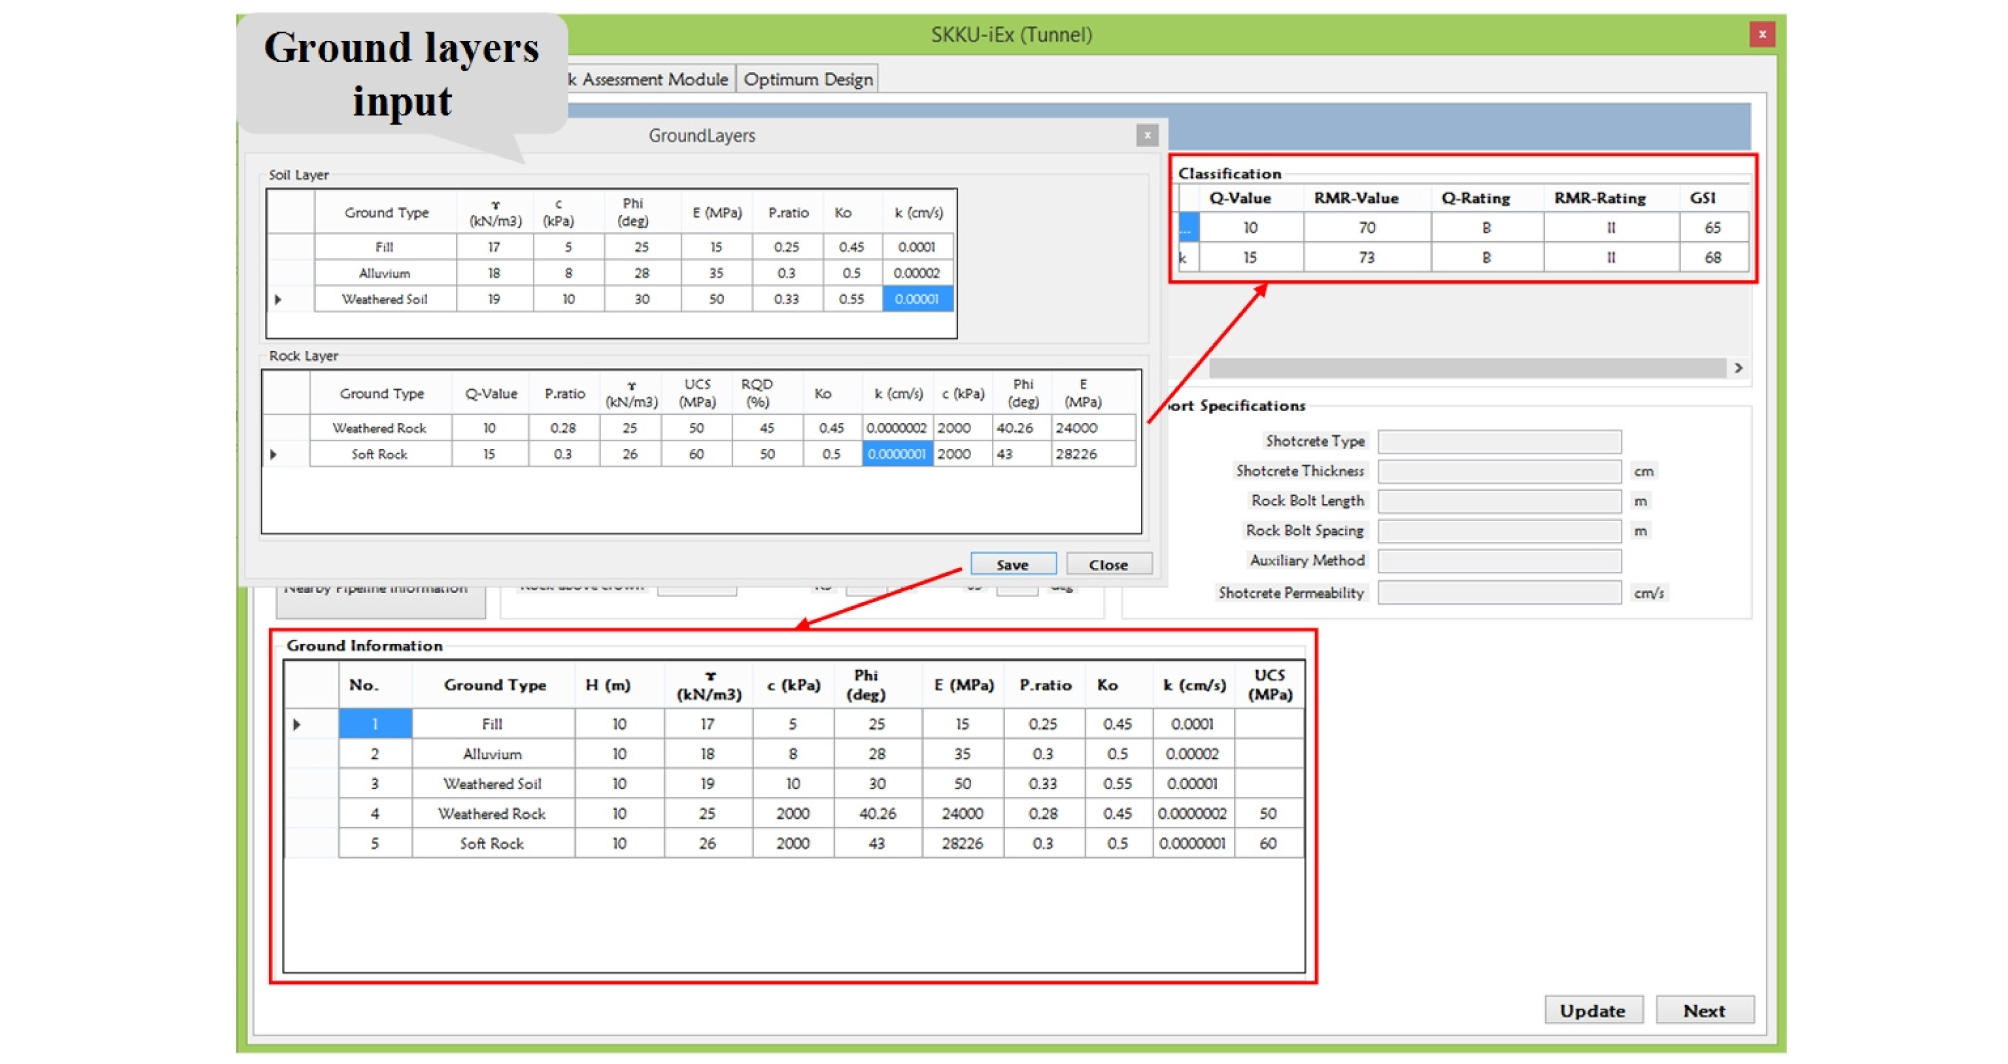
In rock properties table based on the entered inputs, m-c parameters i.e. cohesion and friction angle are auto calculated based on Eq. (9), 10(a) and 10(b) proposed by Heok et al. (2002), while rock classification also performed based on these inputs.
| $$E_m=\vert24\;log_{10}\;Q\;\vert$$ | (9) |
| $$\varphi'=sin^{-1}\;\left[\frac{6am_b(s+m_b\sigma_{3n}')^{a-1}}{2(1+a)(2+a)+6am_b(s+m_b(\sigma_{3n}')^{a-1}}\right]$$ | (10a) |
| $$c'=\frac{q_u\lbrack(1+2a)s+(1-a)m_b\sigma_{3n}'\rbrack(s+m_b\sigma_{3n}')^{a-1}}{(1+a)(2+a)\;\sqrt{\displaystyle\frac{1+6am_b(s+m_b\sigma_{3n}')^{a-1}}{(1+a)(2+a)}}}$$ | (10b) |
Where in Eq. (9) Em is elastic modulus of rock, Q is input value for the rock, i.e. rock rating value based on Q-system (Grimstad and Barton 1993). While in Eq. 10(a) and 10(b), qu is compressive strength of intact rock, and σ3 is minor principle stress and a, s and mb are material constants given as follows;
| $$a=\frac12+\frac16\left(e^\frac{GIS}{15}-e^\frac{-20}3\right)\;\;\;\;\;\;\;\;\;s=exp\;\left(\frac{GSI-100}{9-3D}\right)$$ |
| $$\frac{m_b}{m_i}=exp\;\left(\frac{GSI-100}{28-14D}\right)$$ |
Where GSI is geological strength index and can be obtained from Q-value using 9 loge Q+44. D is disturbance factor having values from 0 undisturbed in situ rock masses to 1 for very disturbed rock masses. mi is material constant for intact rock mass that is documented by Hoek et al. (1995) for different rock types.
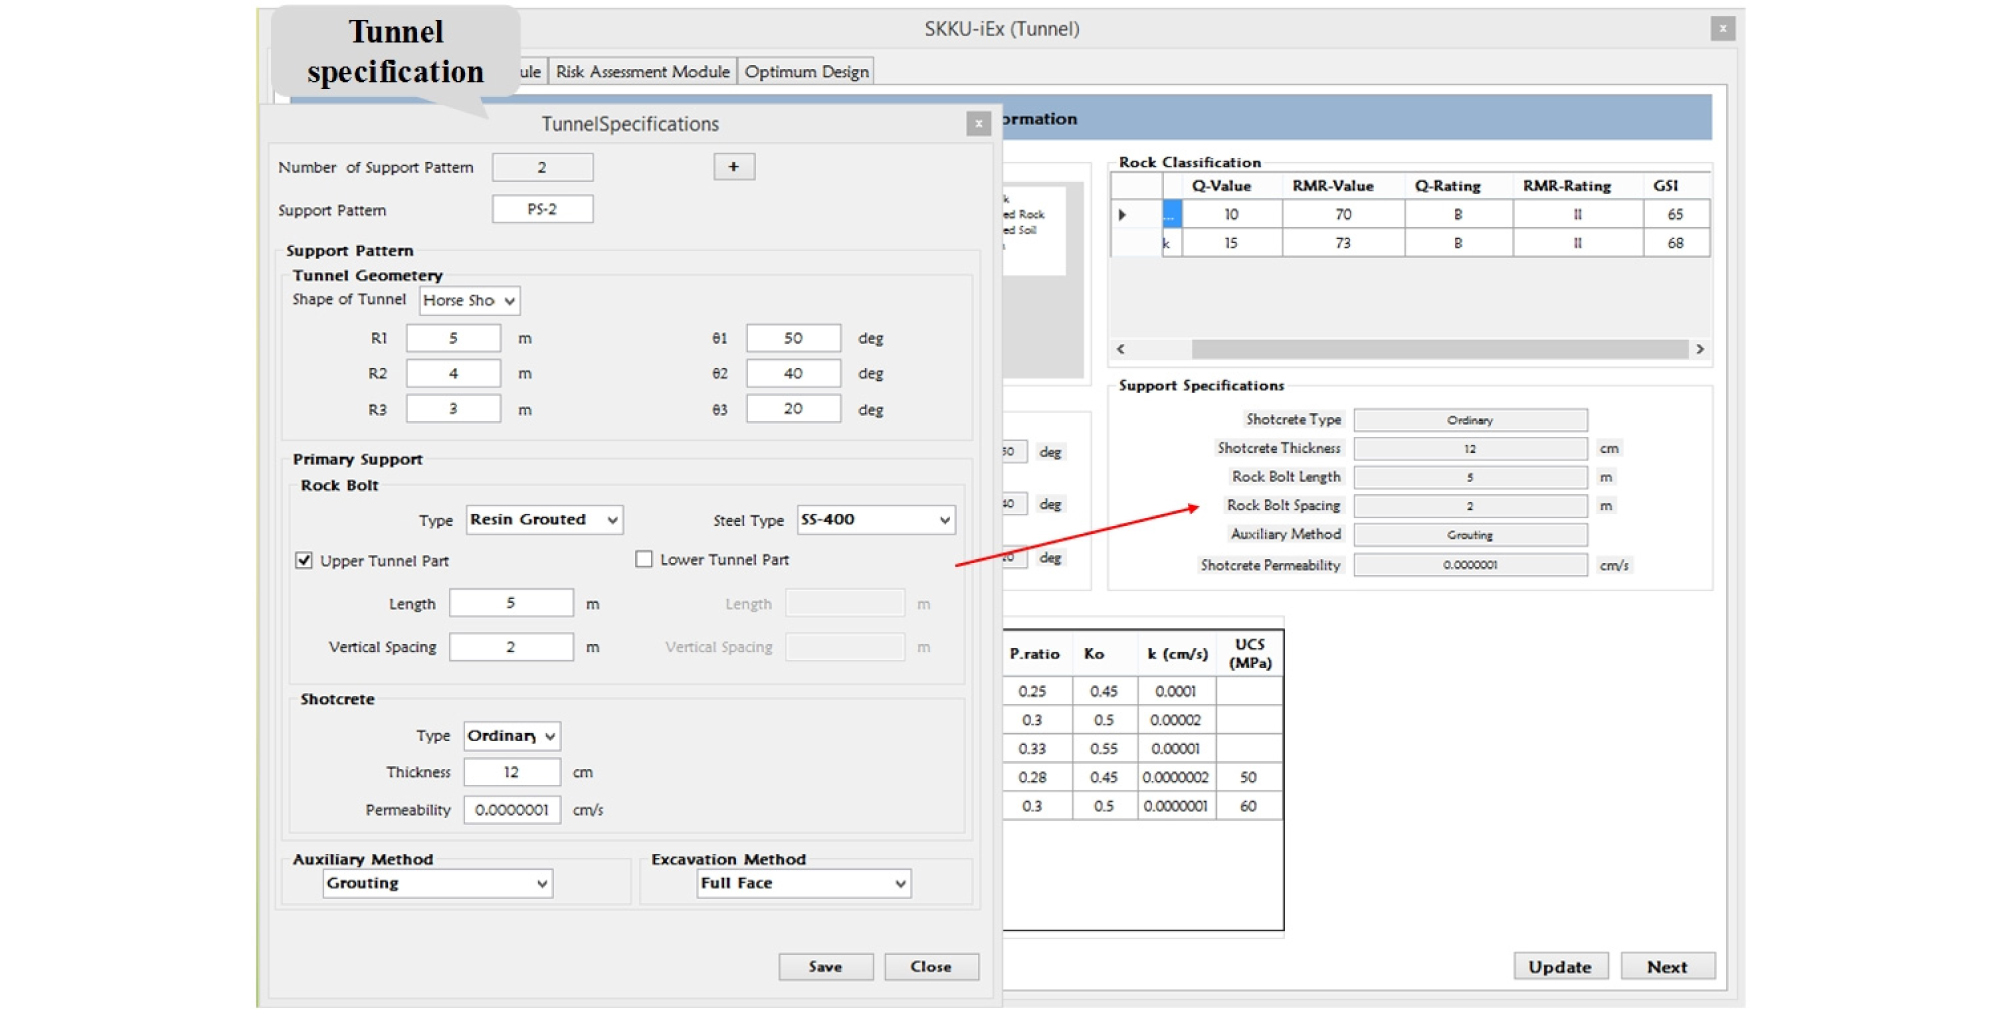
Tunnel specification tab contains support pattern and tunnel geometry inputs as shown in Fig. 10. Under support pattern, tunnel geometry is defined, based on selected shape either horseshoe or circular tunnel geometry parameters are added. Primary support contains rock bolt and shotcrete while auxiliary method contains forepolling, piperoofing and grouting.
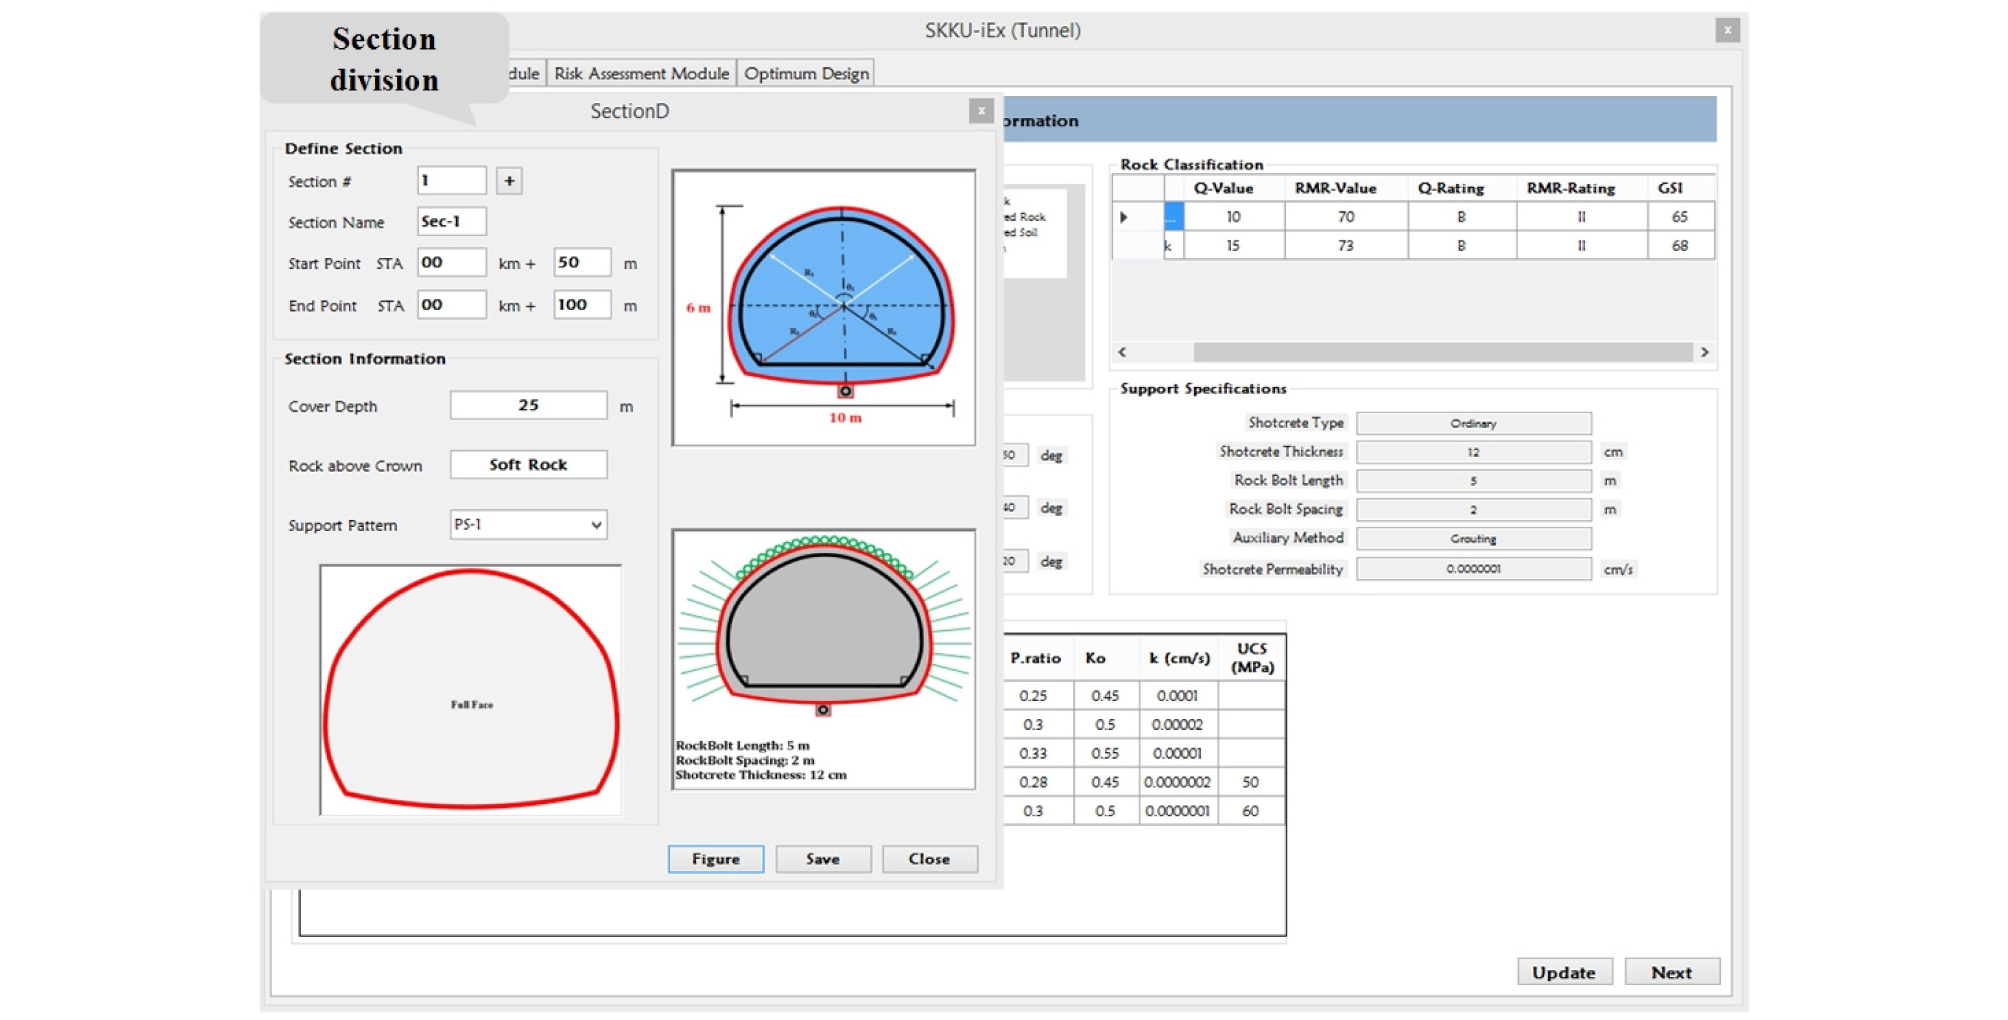
In section division dialogue, sections are defined based on length, number and name. Every section is assigned with a support pattern defined in previous section that can be accessed from a dropdown menu while tunnel graphics are updated accordingly as shown in Fig. 11.
3.3 Settlement & Groundwater module
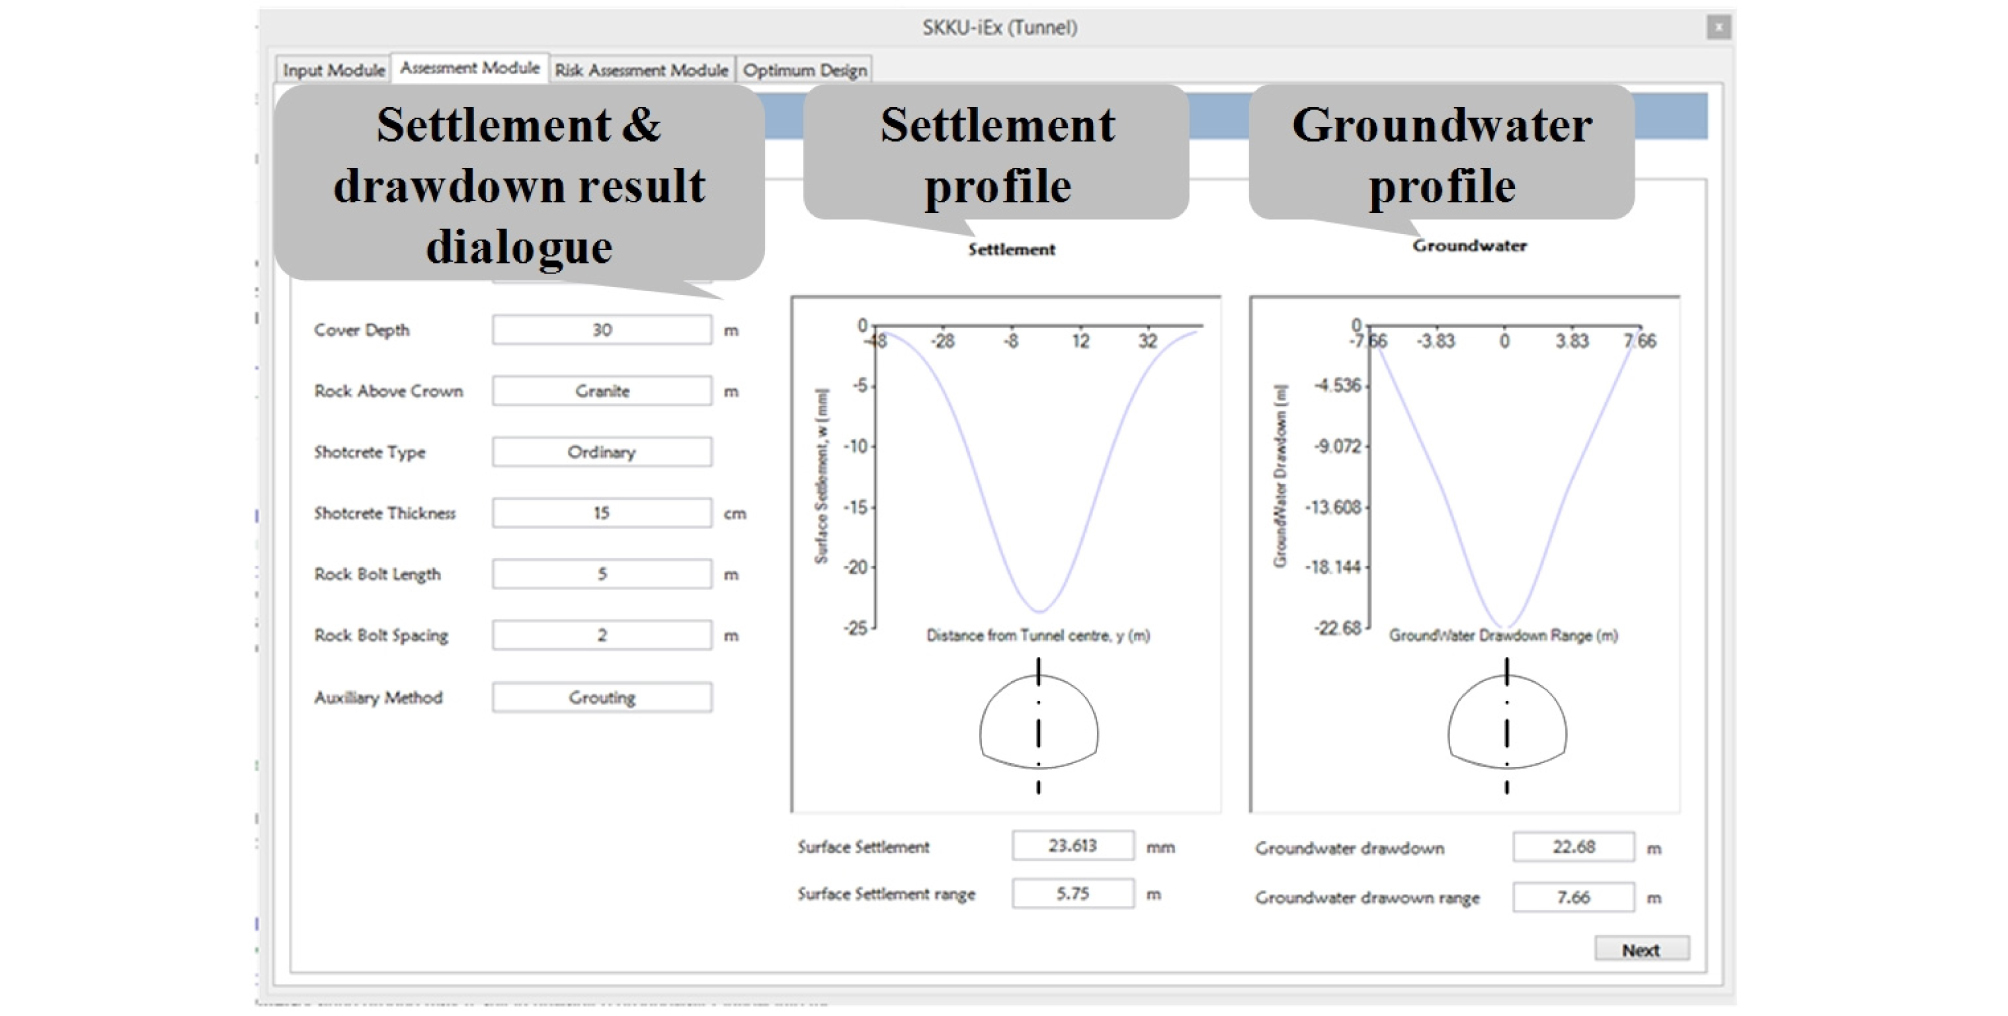
This module performs the calculations based on ANN deployed in the program by using sigmoid transfer function. Surface settlement, settlement range, groundwater drawdown and drawdown range are the ANN output parameters that are presented here along with the calculated profiles for settlement and drawdown as show in Fig. 12. Moreover, these calculated values are saved in database to be used in the damage assessment calculations.
3.4 Building & Pipeline assessment module
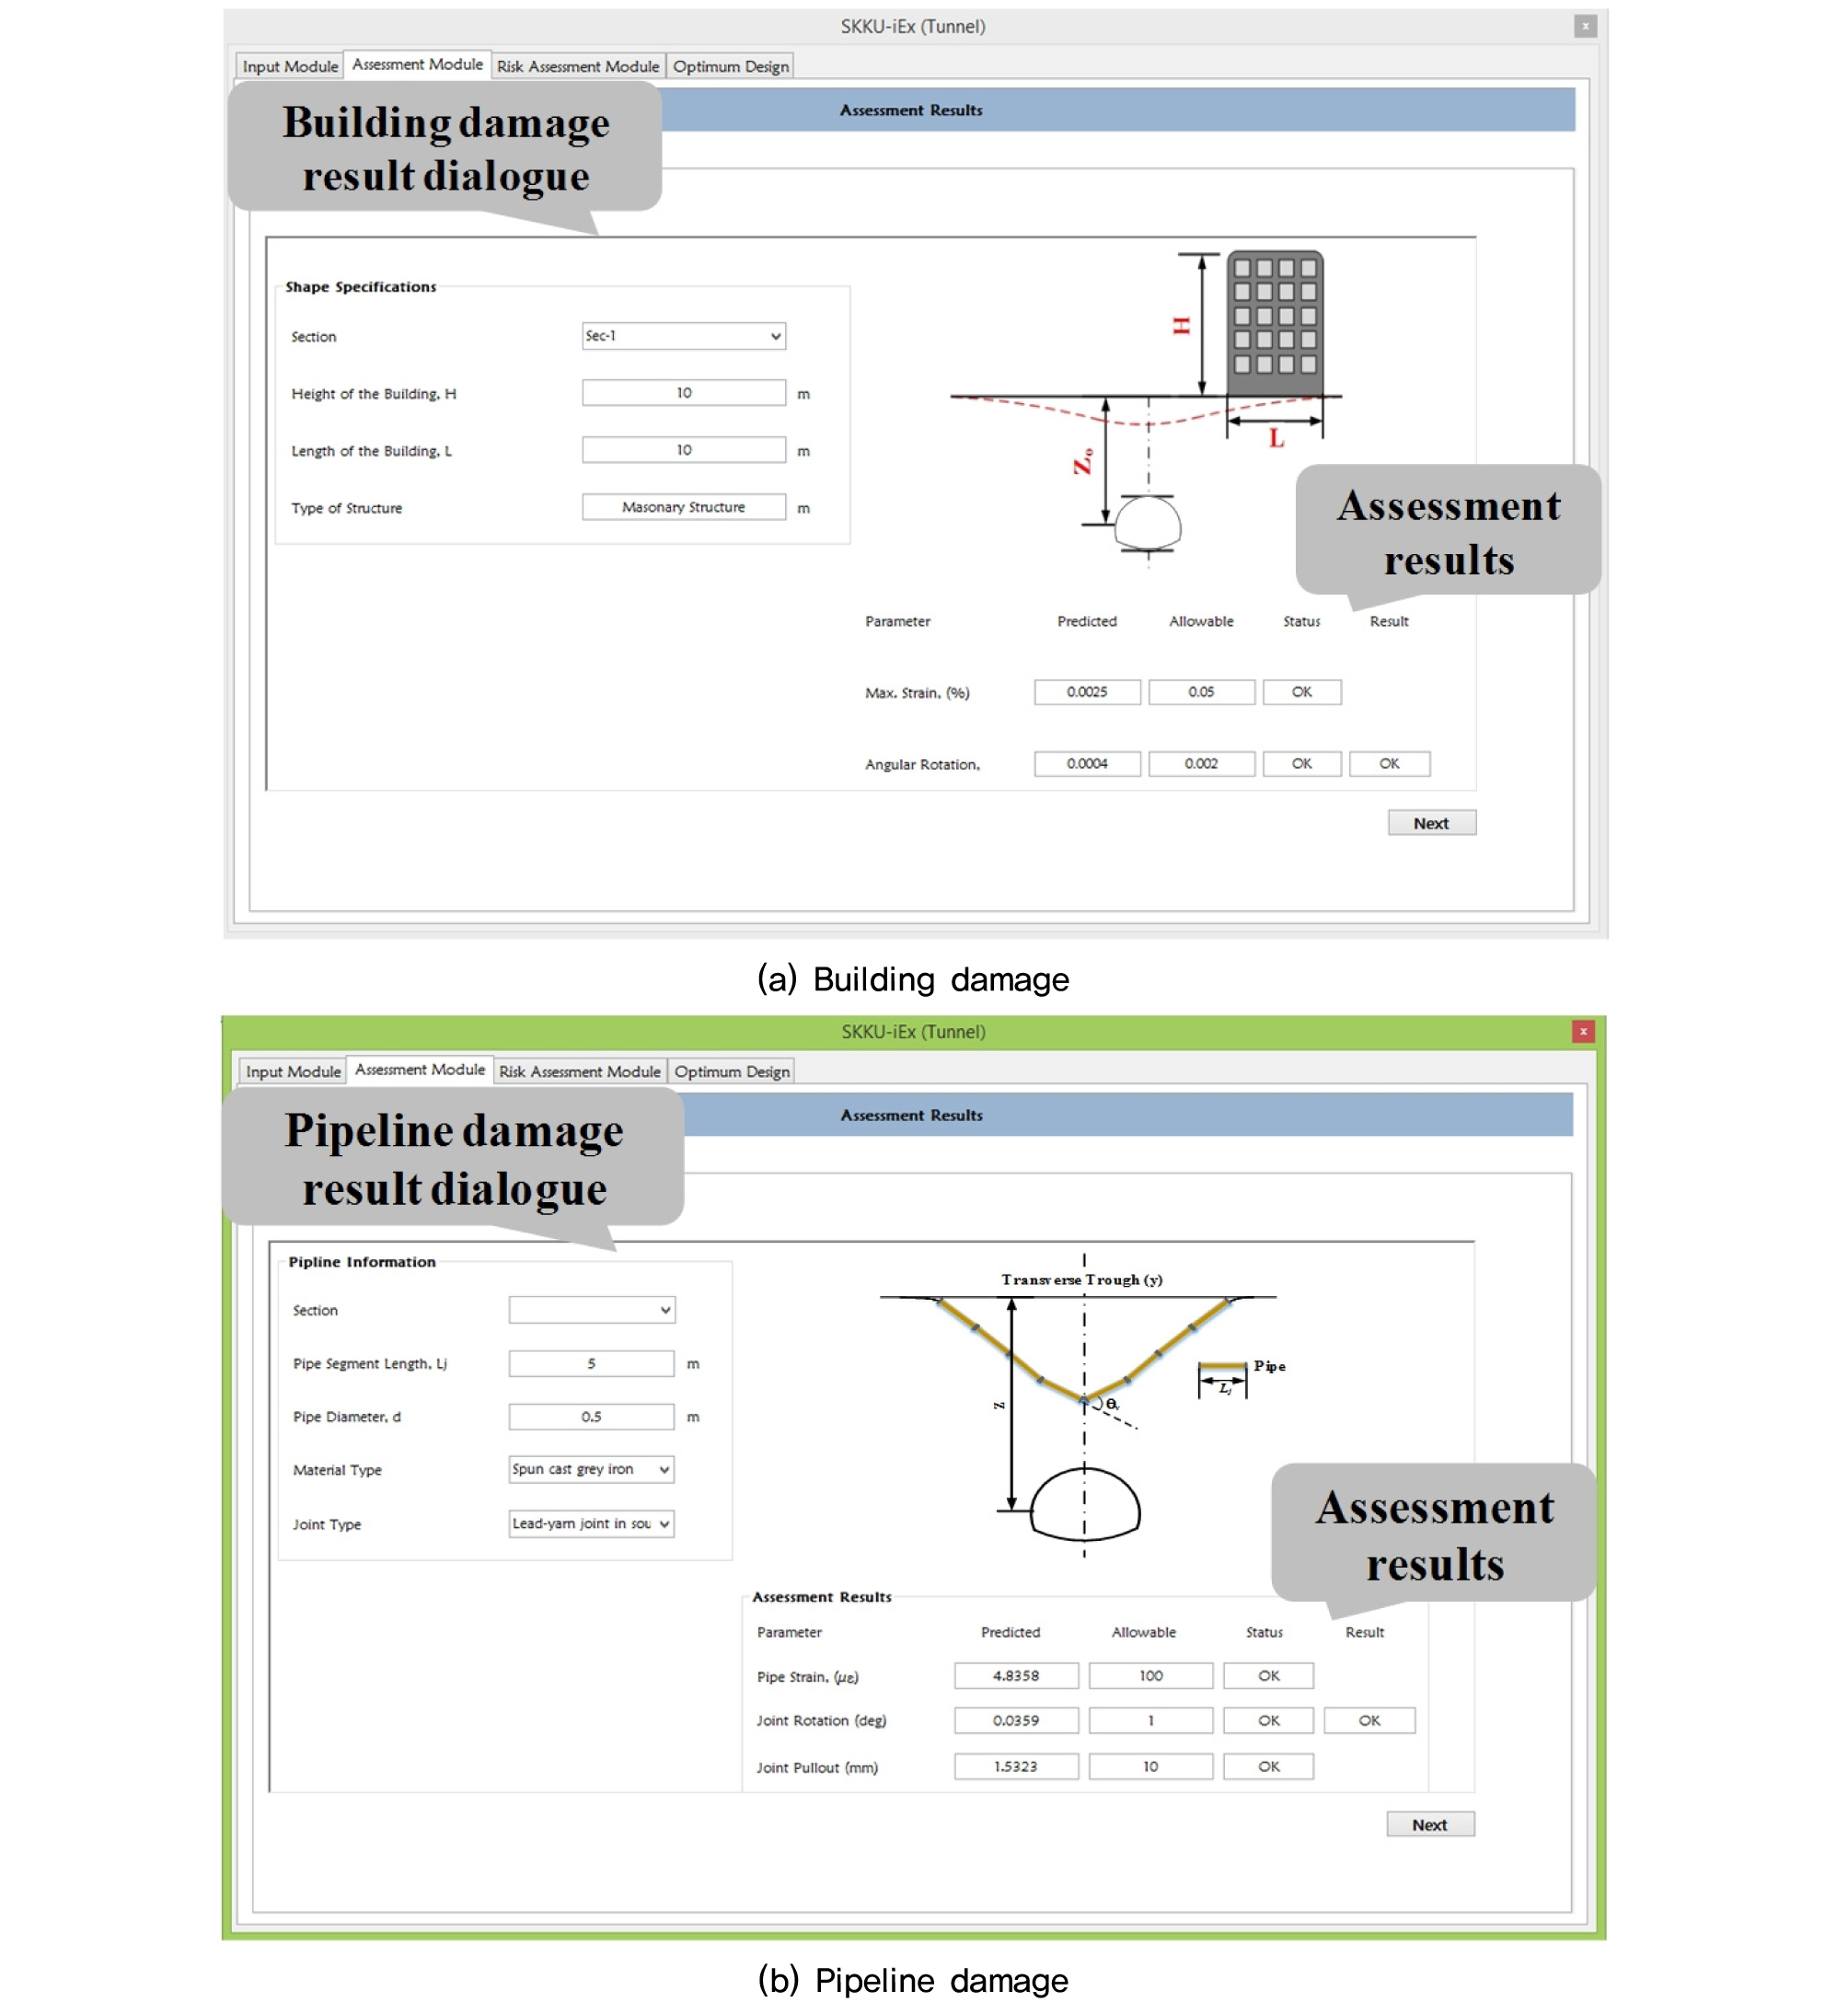
This module performs the calculations based on predicted surface settlement values and simplified damage assessment formulas as described in section 2.3. Results for each item can be checked by selecting the concerned item from the dropdown, i.e. Building damage assessment and pipeline damage assessment. Building damage assessment is done for building strain and angular rotation while pipeline damage assessment is done for pipe strain, joint rotation and joint pullout. These calculated values are then compared with the standard allowable values and status of each assessment is updated based on this comparison. In addition to the resulting values description pictures are also shown as visible in Fig. 13 (a) and 13 (b). details for the damage assessment are provided in section 4 below.
4. Program Evaluation Using Field Data
4.1 Example problem description
Analyze a 100 meters horseshoe tunnel section for a given ground profile as shown in Fig. 14 mapped through borehole data presented in Table 3 having a cover depth of 71 meters. Properties of ground layers are given in Tables 4 and 5, respectively for Soil and rock layers. A support pattern PD-4A described in Table 6, is used to support the tunnel walls. Compute surface settlement and groundwater drawdown induce to the tunneling activity. Also, perform the damage assessment for the nearby masonry building located 10 meters away from the tunnel axis, having 10 meters and 10 meters width and pipeline having segment length of 5 m, pipe diameter of 0.5 m made of spun cast grey iron material and Lead-yarn joint in water mains.
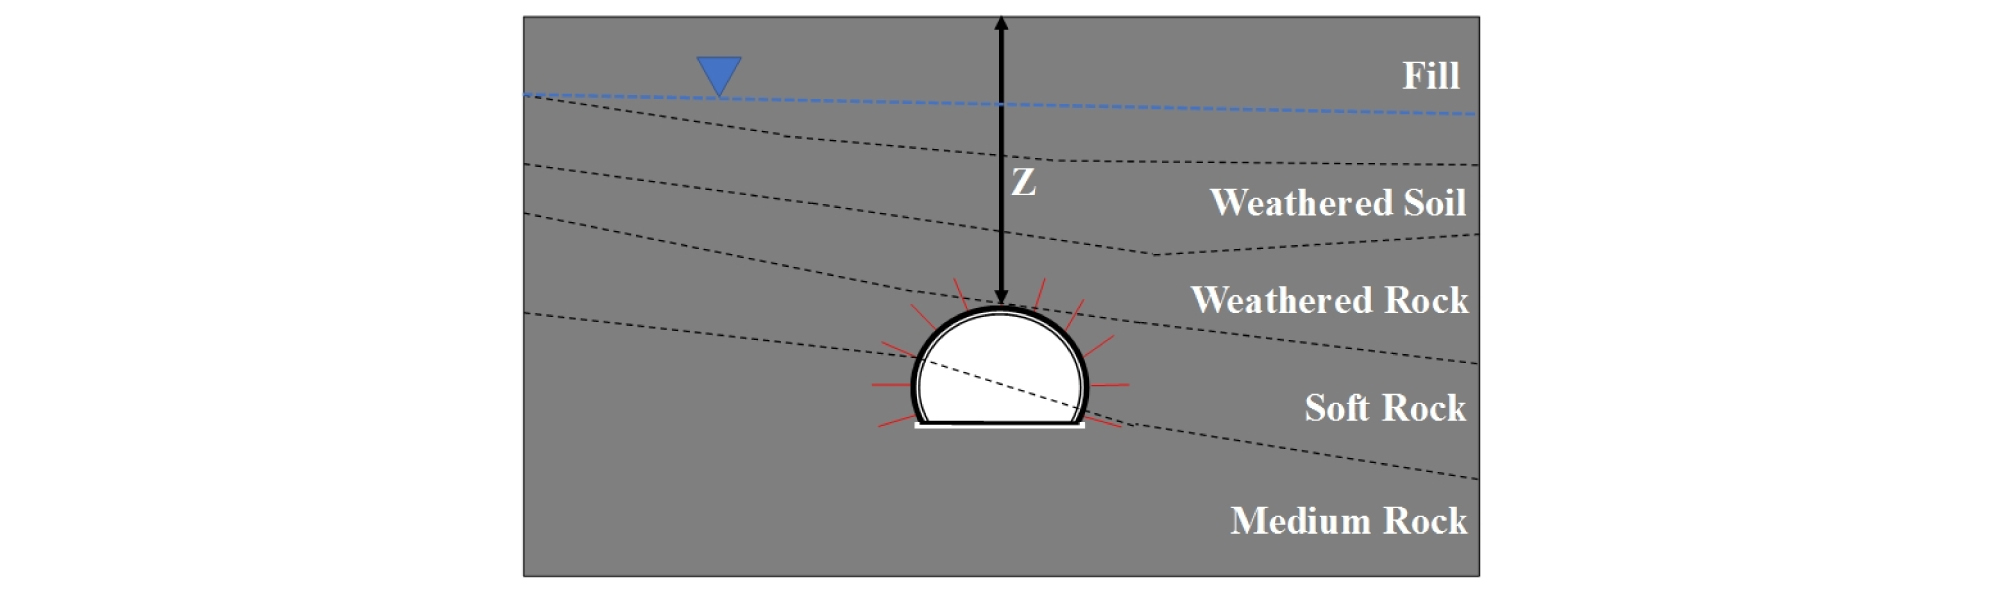
Table 3. Borehole information
Table 4. Soil layer information
| Strata type | γ (kN/m3) | c (kPa) | φ (°) | E (MPa) | υ | k (cm/s) |
| Fill | 18 | 0 | 28 | 20 | 0.36 | 0.0011 |
| Weathered soil | 19 | 22 | 31 | 50 | 0.34 | 0.000098 |
Table 5. Rock layer information
| Strata type | γ (kN/m3) | RQD | Q-value | υ | k (cm/s) | UCS (MPa) |
| Weathered rock | 21 | 10 | 1.3 | 0.32 | 0.000035 | 40 |
| Soft rock | 23 | 30 | 8 | 0.26 | 0.000022 | 80 |
| Medium rock | 25 | 50 | 20 | 0.20 | 0.0000051 | 120 |
Table 6. Support pattern PD-4A
| Parameter | PD-4A | |
| Rock above crown | Weathered rock |  |
| Shotcrete type | SRF | |
| Shotcrete thickness | 200 mm | |
| Rock bolt length | 4 m | |
| Rock bolt spacing | 1.2 m | |
| Auxiliary method | Grouting |
Table 7. Results for Settlement & groundwater module
| Parameter | Program | ABAQUS | % error |
| Surface Settlement, (mm) | 15.023 | 15.02 | 0.02 |
| Settlement Range, (m) | 7.5 | 7.5 | 0 |
| Groundwater drawdown, (m) | 21.27 | 21.31 | 0.2 |
| Drawdown Range, (m) | 10.82 | 10.8 | 0.2 |
4.2 Evaluation results
Results for settlement and groundwater drawdown are shown in Table 7. These are results are the predicted values by the implemented ANN.
The ANN predicted results for surface settlement and groundwater drawdown are also compared with the original case used for the ANN training prepared from ABAQUS. From table it can be seen that ANN based prediction of the program have comparable accuracy with the ABAQUS data as the percentage error is less than 1%.
Building damage assessment results are shown in Table 8. Assessment is done for maximum strain and angular rotation induced in the building due to tunneling induced surface settlement. The calculated values are compared with the allowable values given in Table 9 for limiting strain while the allowable value for angular rotation in masonry structure is 0.002 degrees.
From the results, the induced strain in the building is quite low as compared to the allowable value. The range obtained for limiting strain suggests that category of damage for the given case is 0 that means the structure is safe for the given tunnel section and induced settlements. So, no modification or preventive measures are required further, and building is considered as safe.
Pipeline damage assessment results are shown in Table 10. Assessment is done for maximum strain, joint rotation and joint pullout induced in the pipeline due to tunneling induced surface settlement. The calculated values are compared with the allowable values given in Table 11 for joint rotation and pullout.
From the results, the induced strain, joint rotation and joint pullout values in the pipeline are very low as compared to the allowable values. The results suggest that the pipeline with the given diameter and joint type is safe for the predicted tunneling induced settlement values. There is no need to modify the support pattern or pipeline specifications for the given case.
Table 8. Results for Building damage assessment
| Parameter | Calculated | Allowable | Status |
| Maximum Strain, (%) | 0.0064 | 0.05 | OK |
| Angular Rotation, (o) | 0.0007 | 0.002 | OK |
Table 9. Allowable tensile strain limits for buildings (after Boscardin and Cording, 1987)
| Category of damage | Limiting strain (%) |
| 0 | 0~0.05 |
| 1 | 0.05~0.075 |
| 2 | 0.075~0.15 |
| 3 | 0.15~0.3 |
| 4,5 | > 0.3 |
Table 10. Results for Pipeline damage assessment
| Parameter | Calculated | Allowable | Status |
| Maximum Strain, (με) | 13.5 | 100 | OK |
| Joint Rotation, (°) | 0.062 | 1.5 | OK |
| Joint Pullout, (mm) | 1.8 | 15 | OK |
Table 11. Allowable limits for joint rotation and pull-out (after Attewell et al., 1987)
5. 결 론
In this study the development and implementation of an ANN based tunnelling impact assessment system (SKKU-iTunnel) is presented. The program calculates induced surface settlement and groundwater drawdown based on the given inputs for a given tunnel section. Program also, calculates the damage assessment and checks the calculated values to the allowable values.
Through an example in section 4 it is demonstrated that with a carefully trained ANN SKKU-iTunnel can predict the tunnelling induced settlements and groundwater drawdown with a comparable accuracy to the numerical analysis program ABAQUS. The damage assessment computations based on simplified approach by utilising predicted settlements can be performed efficiently and within no time that make the program very useful for preliminary assessment tool for a tunnelling project.
Due to the limited range of datasets used to train the ANN this program can only be used as a preliminary analysis and assessment tool and before it can be applied to a real field tunnelling project it should be rigorously tested and validated.
