

1. Introduction
2. Tunneling Condition Considered
3. Numerical Simulation
3.1 Model description
3.2 Cases analyzed
3.3 Analysis procedure
4. Results And Discussion
4.1 General behaviour
4.2 Comparison of different depth
4.3 Comparison of different spacing
5. Conclusion
1. Introduction
The cross passage in the middle of the main tunnels plays the roles of connecting two tunnels, collecting, draining, fire preventing, and evacuating (Murakami and Koizumi, 1980; Ding et al., 2013). The construction of the cross passage changes the main tunnels lining from a complete cylindrical structure to an unstable force structure with notches; thus, the overall force performance of the tunnel is considerably decreased (Han et al., 2016; Wang et al., 2013). The excavation of the cross passage also destroys the stability of the original soil layer and the main tunnels and causes difficulty in avoiding the settlement of the surface and the displacement of the main tunnels (Yi and Tong, 2015; Alhaddad et al., 2016). The influence of the excavation of the cross passage on the surface and main tunnels is related to the overlying soil thickness, therefore, the influence of different buried depths can be analyzed by changing the physical parameters of the model.
Accurate analysis of the mechanical behaviour of the surrounding rock and the change of the intersection lining during the construction of the main tunnels and cross passage is the primary prerequisite and necessary condition to ensure the safe, rapid, and economical construction (Yoo, 2009; 2017). Cho et al. (2015) carried out a series of model tests were on deep tunnels considering different fault zone orientations and offset distance and presented the results of reduced scale model tests on the effect of fault zone characteristics on the tunnel deformation behaviour. Liu et al. (2013) applied numerical simulation method to study the mechanical behaviour of the lining during the construction of a shield tunnel cross passage in Beijing Metro. Through on-site monitoring analysis and 3D finite element numerical analysis of the mechanical behaviour of the lining during the construction of the cross passage, the construction process and lining opening were obtained. Lim et al. (2017) describe horizontal grouting techniques applied to cross passage excavation, including analysis and interpretation of grouting results in rock and soil.
In this study, the mechanical characteristics of the construction of the main tunnels and cross passage are analyzed using Fast Lagrangian Analysis of Continua in 3 Dimensions (FLAC3D) numerical simulation software. Then, practical implications of the findings are discussed.
2. Tunneling Condition Considered
The general construction sequence of the cross passage:
① Ground reinforcement. The range of grouting reinforcement zone is 3.0 m on both sides of the cross passage and 3.0 m on the upper and lower sides of the cross passage.
② Opening sequence. From top to bottom, first remove the linings from the upper part. Then remove the lower linings of the hole.
③ Before entering the cross passage, the Ф42 pre grouting is used to reinforce the excavation face. The grouting pipe is 2.5 m long and the spacing is 0.3 m. The slurry is made of pure cement.
④ The full-face excavation method is used during the construction of cross passage, and initial support should be applied in time. The length of a single excavation should be 1∼3 m.
⑤ Monitoring should be strengthened during the construction process, where the crown settlement and surrounding convergence points should be set.
3. Numerical Simulation
3.1 Model description
The left and right lines of the main tunnel have an outer diameter of 6.0 m and an inner diameter of 5.4 m. And the tunnel depth is 9 m. The cross passage is constructed by full-face excavation with a length of 10 m, an excavation section width of 3 m, a height of 4.3 m and a lining thickness of 0.2 m. The final dimensions of the model are as follows: length of 60 m, width of 70 m, height of 47 m. The final numerical model is shown in Figure 1. It is divided into 83,493 elements and 78,949 nodes by ANSYS.
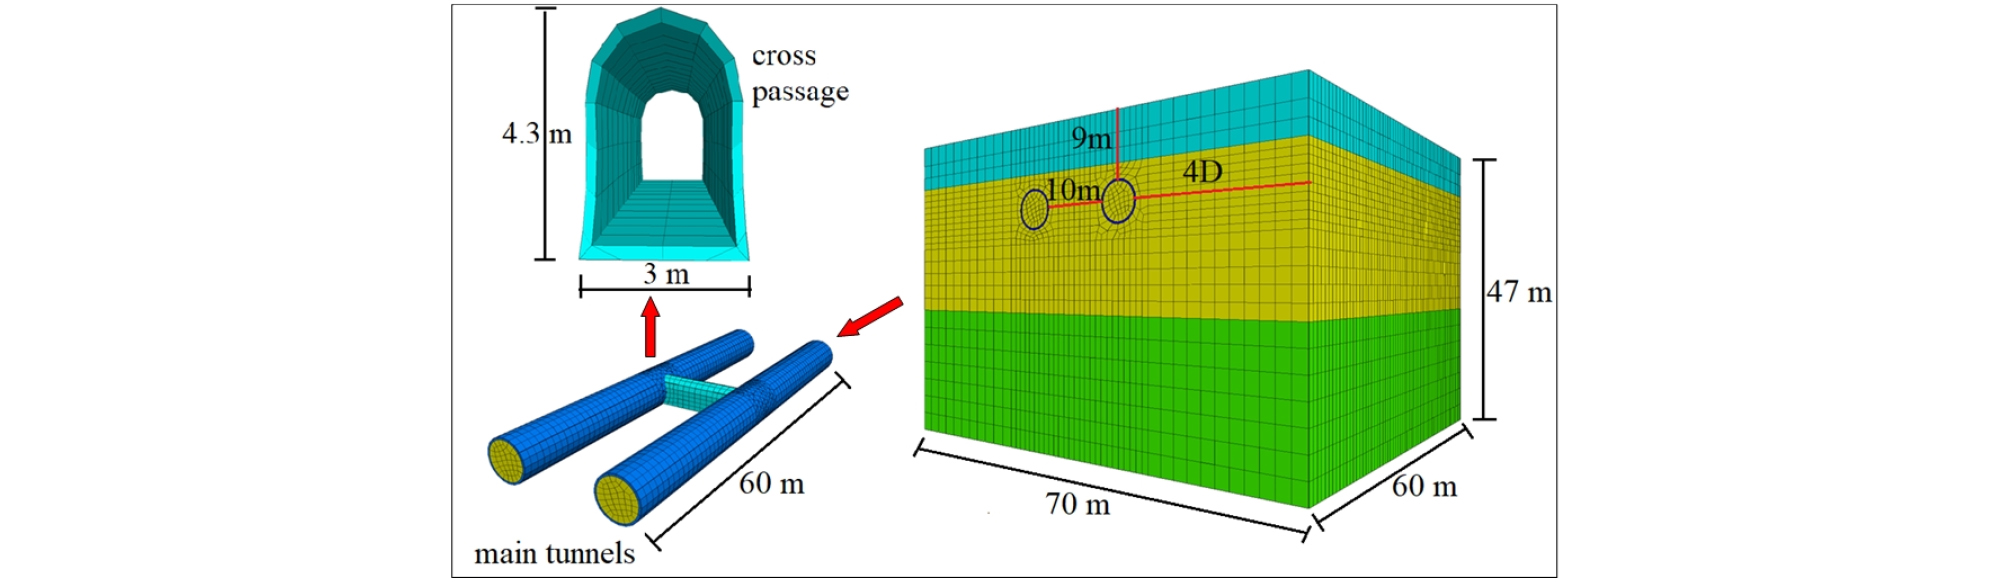
Table 1 presents the calculation parameters according to the geological exploration report of similar project and the corresponding experience of numerical simulation.
Table 1. Material parameter value
Table 2. Bulk modulus and shear modulus value
| Material | Bulk Modulus (MPa) | Shear Modulus (MPa) |
| Plain fill | 45 | 5 |
| Strongly weathered granite | 139.4 | 71.9 |
| Moderately weathered granite | 1000 | 600 |
| Initial support | 4761.9 | 3278.7 |
The conversion relationship between (Elastic modulus E and Poisson’s ratio ν) and (Bulk modulus K and Shear modulus G) is as follows:
| $$K=\frac E{3(1-2v)}$$ | (1) |
| $$G=\frac E{2(1+v)}$$ | (2) |
3.2 Cases analyzed
In order to further study the variation of different depths and different spacings, the following different models were built, as shown in Tables 3 and 4. In Table 3, different buried depths refer to the depth of the main tunnel and D is the diameter of main tunnels.
Table 3. Model of different depths
| Depth | 1.5 D | 3.0 D | 5 D |
| Model | 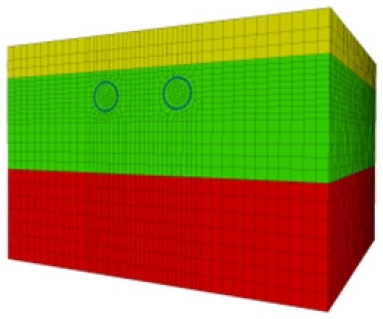 | 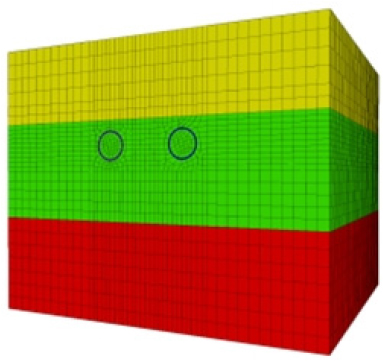 | 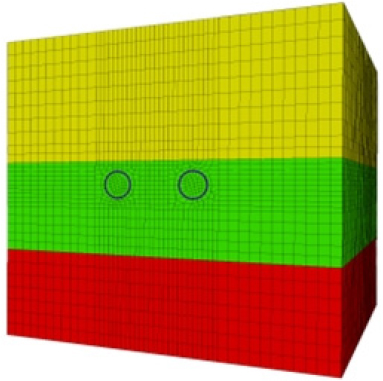 |
Table 4. Model of different spacings
| Depth | 3 m | 6 m | 9 m | 12 m |
| Model | 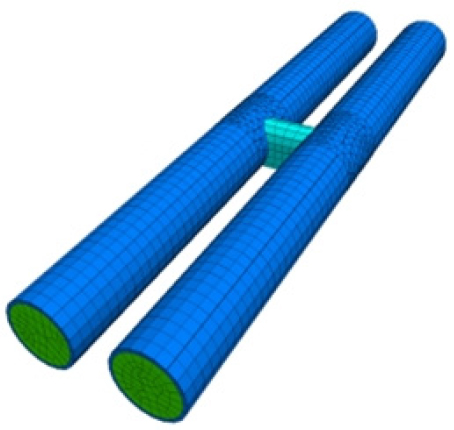 | 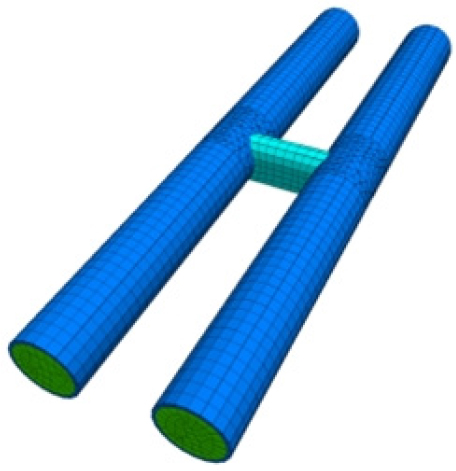 | 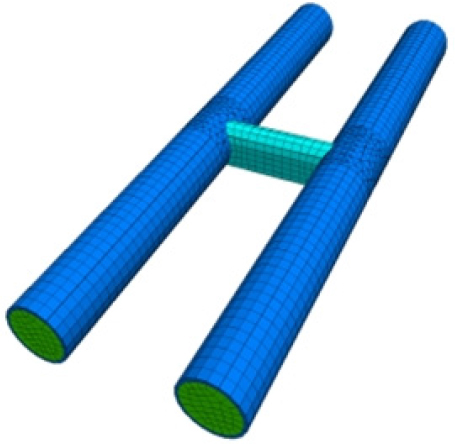 | 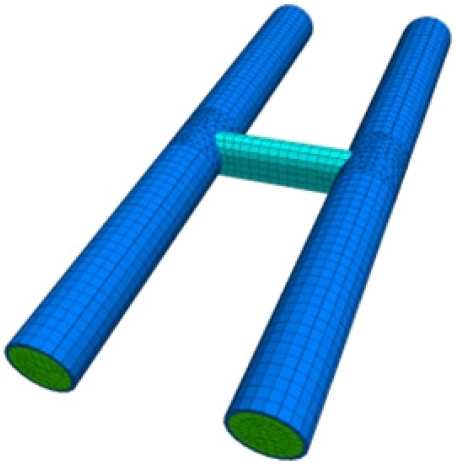 |
3.3 Analysis procedure
Specific numerical method is as follows:
1. Boundary conditions: set normal direction displacement constraints on the left ,right, front and rear boundary of the model, the top of the surrounding rock mass is the free surface, set vertical displacement constraint at the bottom boundary of the model.
2. Main tunnel excavation method: excavate with the entire section method, the single excavation footage is 2 m and a total of 30 steps, two lines were excavated at the same time.
3. Cross passage excavation method: excavate with the entire section method, the single excavation footage is 2 m. The left lining is removed as excavation step 1; the excavation of the soil and the application of initial support are divided into 5 excavation steps. The right lining is removed as excavation step 7.
4. Gravity load are applied by way of self-weight, using Mohr-Coulomb model to calculate gravity stress.
4. Results And Discussion
4.1 General behaviour
4.1.1 Displacement
(1) After main tunnels excavation
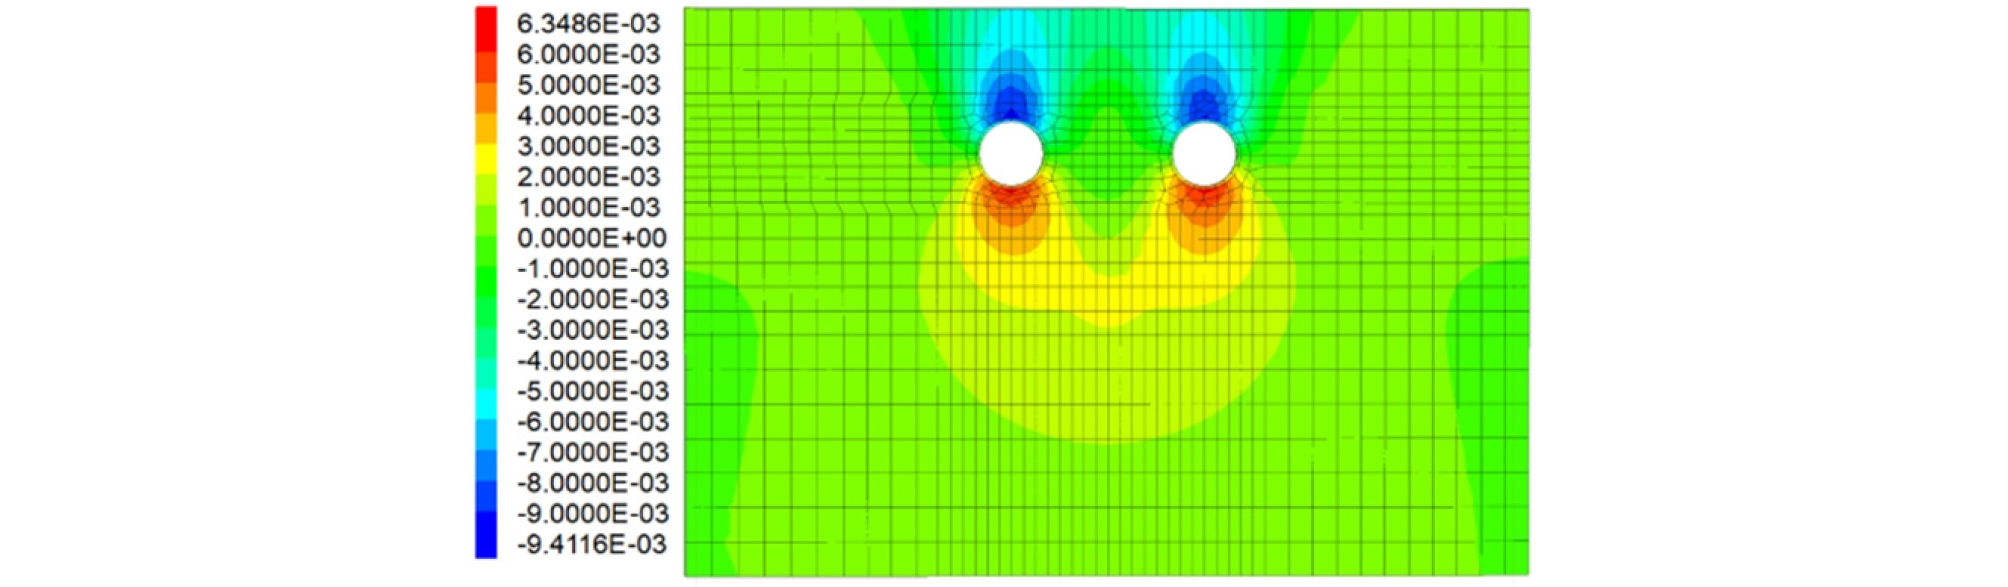
As shown in Fig. 2, after the excavation of main tunnel, the cloud map is basically symmetrical. The maximum settlement of the tunnel crown reaches 9.41 mm. However, since the buried depth reaches 9 m, the rock layer will consume part of the vertical displacement. The settlement of the upper surface is 5.06 mm, and the displacement cloud map has a tendency to move closer to the middle.
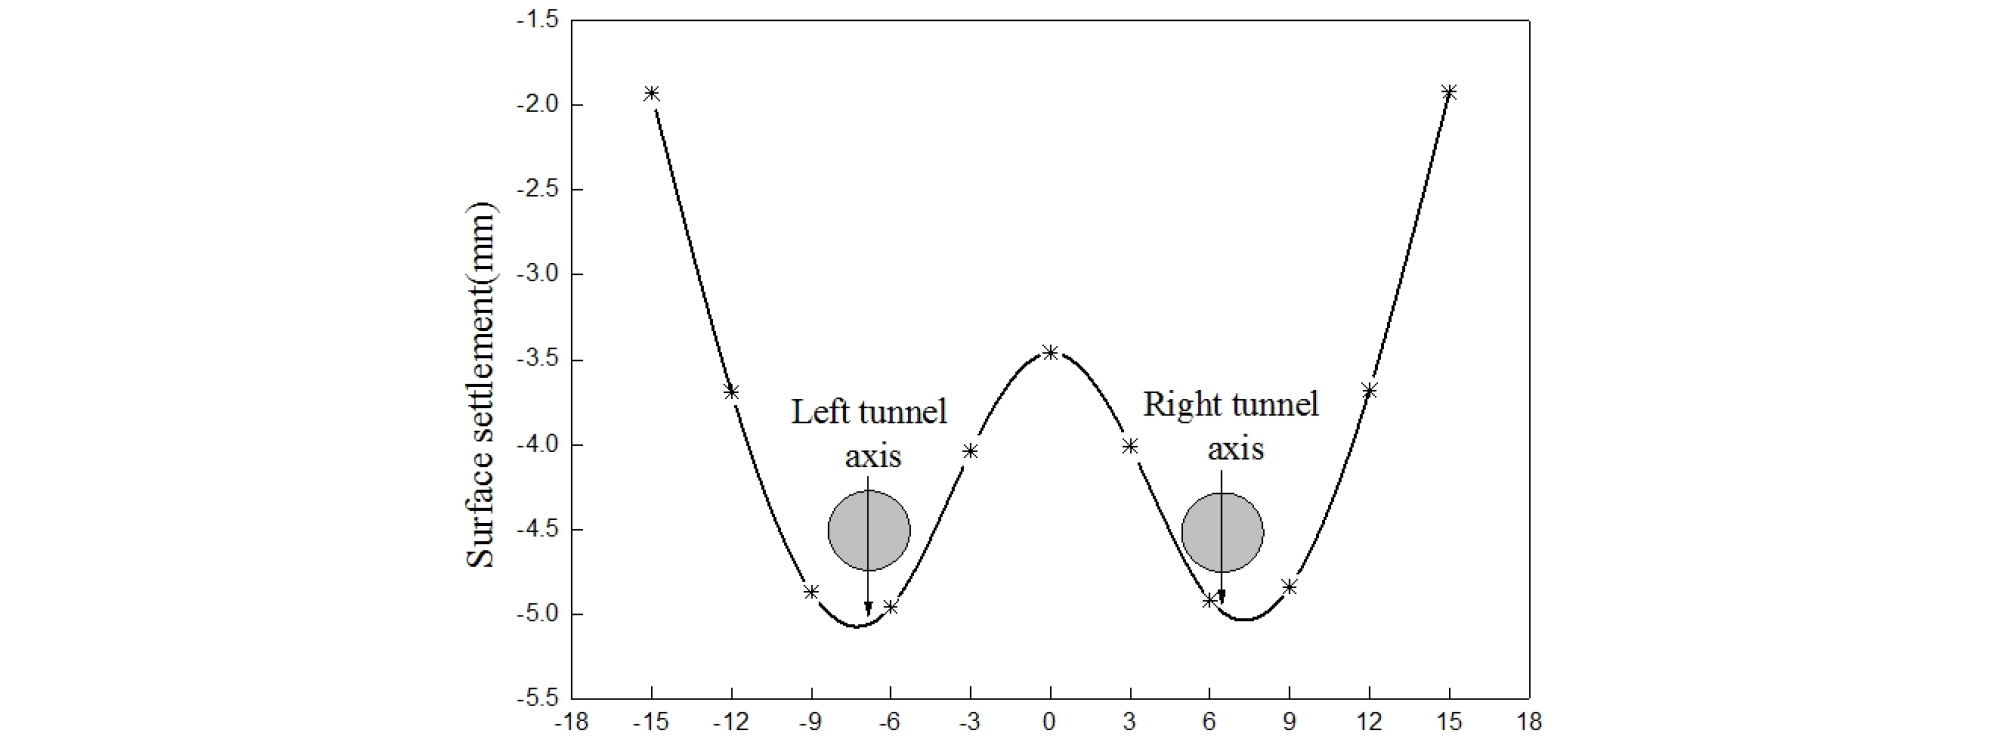
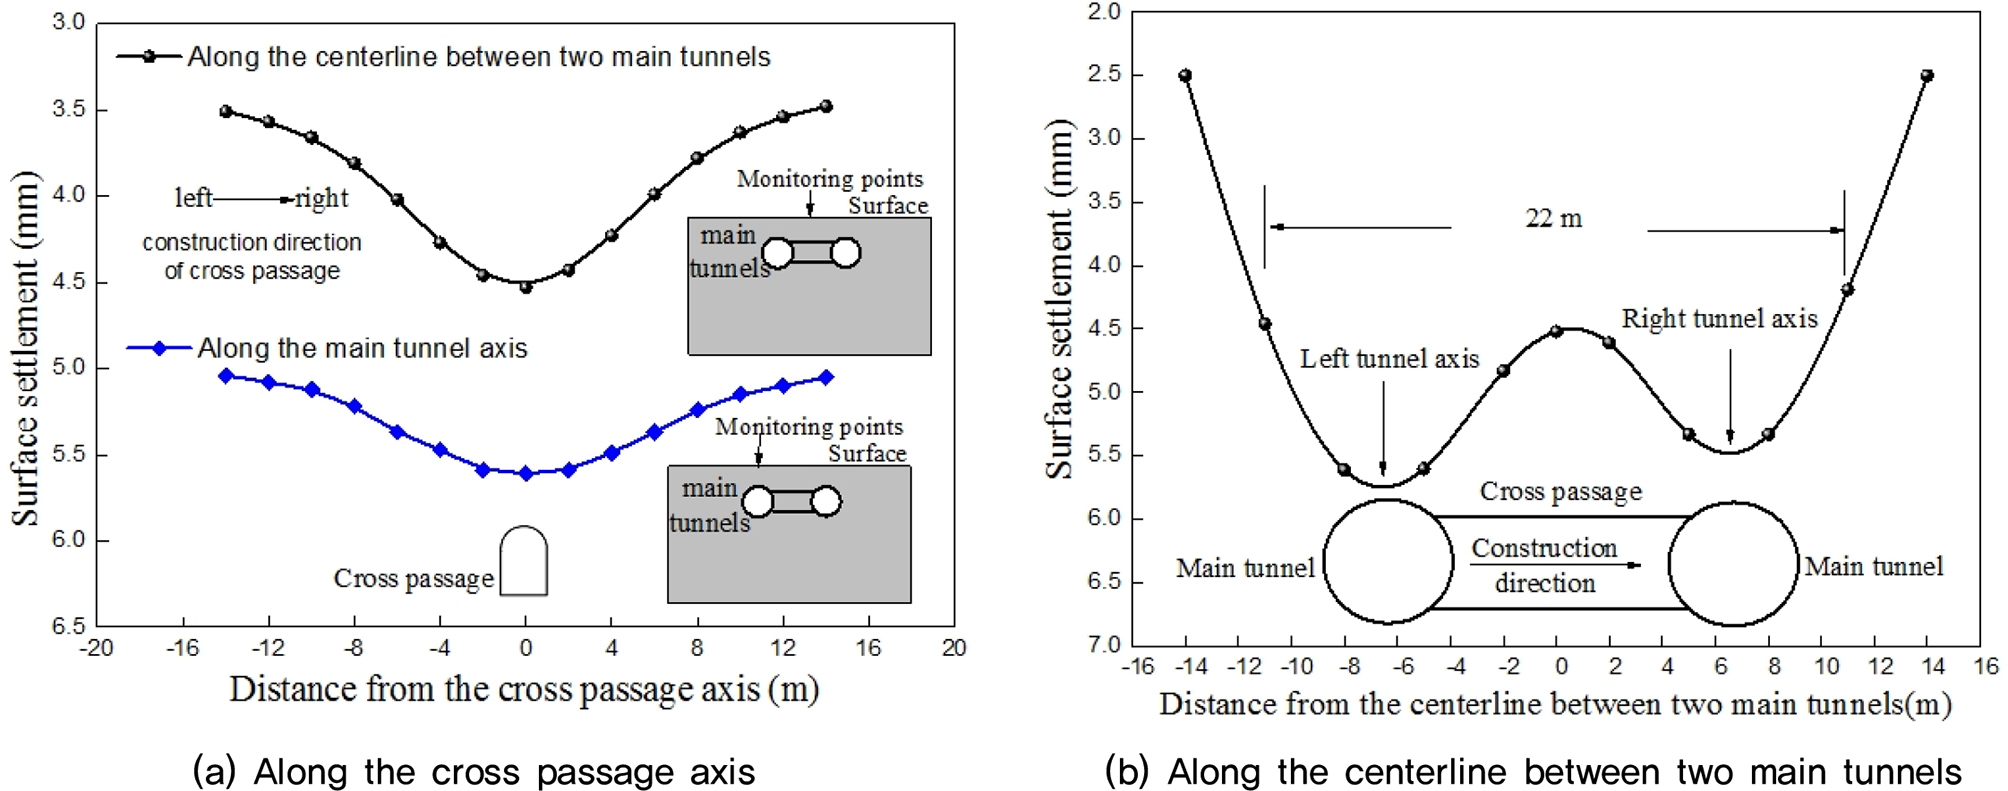
The feature points are set to analyze the surface settlement during construction. Eleven observation points are set equidistantly along the middle of two main tunnels to the two sides. The settlement tendency of each point is shown in Figure 3. As shown in Fig. 3, the curve of surface settlement is "W" shape. There is maximum values in the axis of the left and right tunnels.
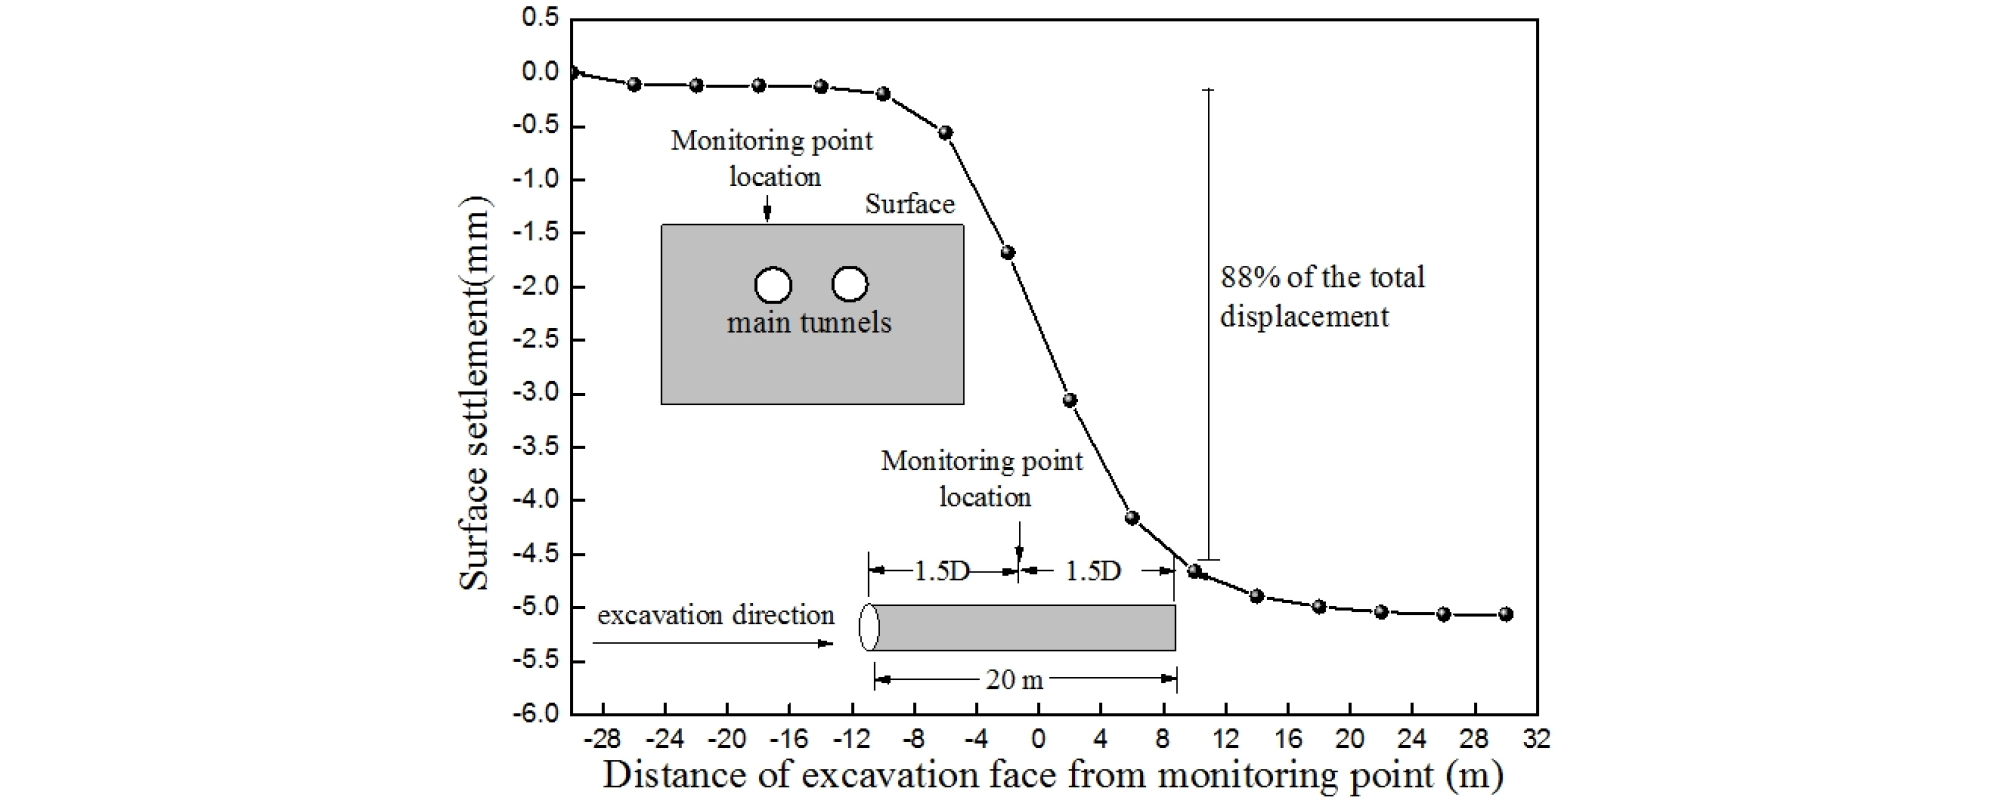
The surface settlement under different excavation steps is shown in Figure 4. As shown in Fig. 4, when the excavation step is less than 10, the curve changes more gently. At this time, the displacement accounts for 5% of the total displacement. The settlement is mainly caused by the change of the stress field. When excavated to step 10 (-1.5D away from the measuring point, D is the outer diameter of the main tunnel, the same below), the rate of settlement change increases sharply, and the curve drops sharply. The boundary conditions change due to excavation, so that the stress field of the surrounding rock is redistributed, resulting in vertical displacement. The displacement caused by excavation in this stage accounts for about 88% of the total displacement. When the tunnel face is excavated to step 20 (1.5D away from the measuring point), the rate of settlement change decreases.
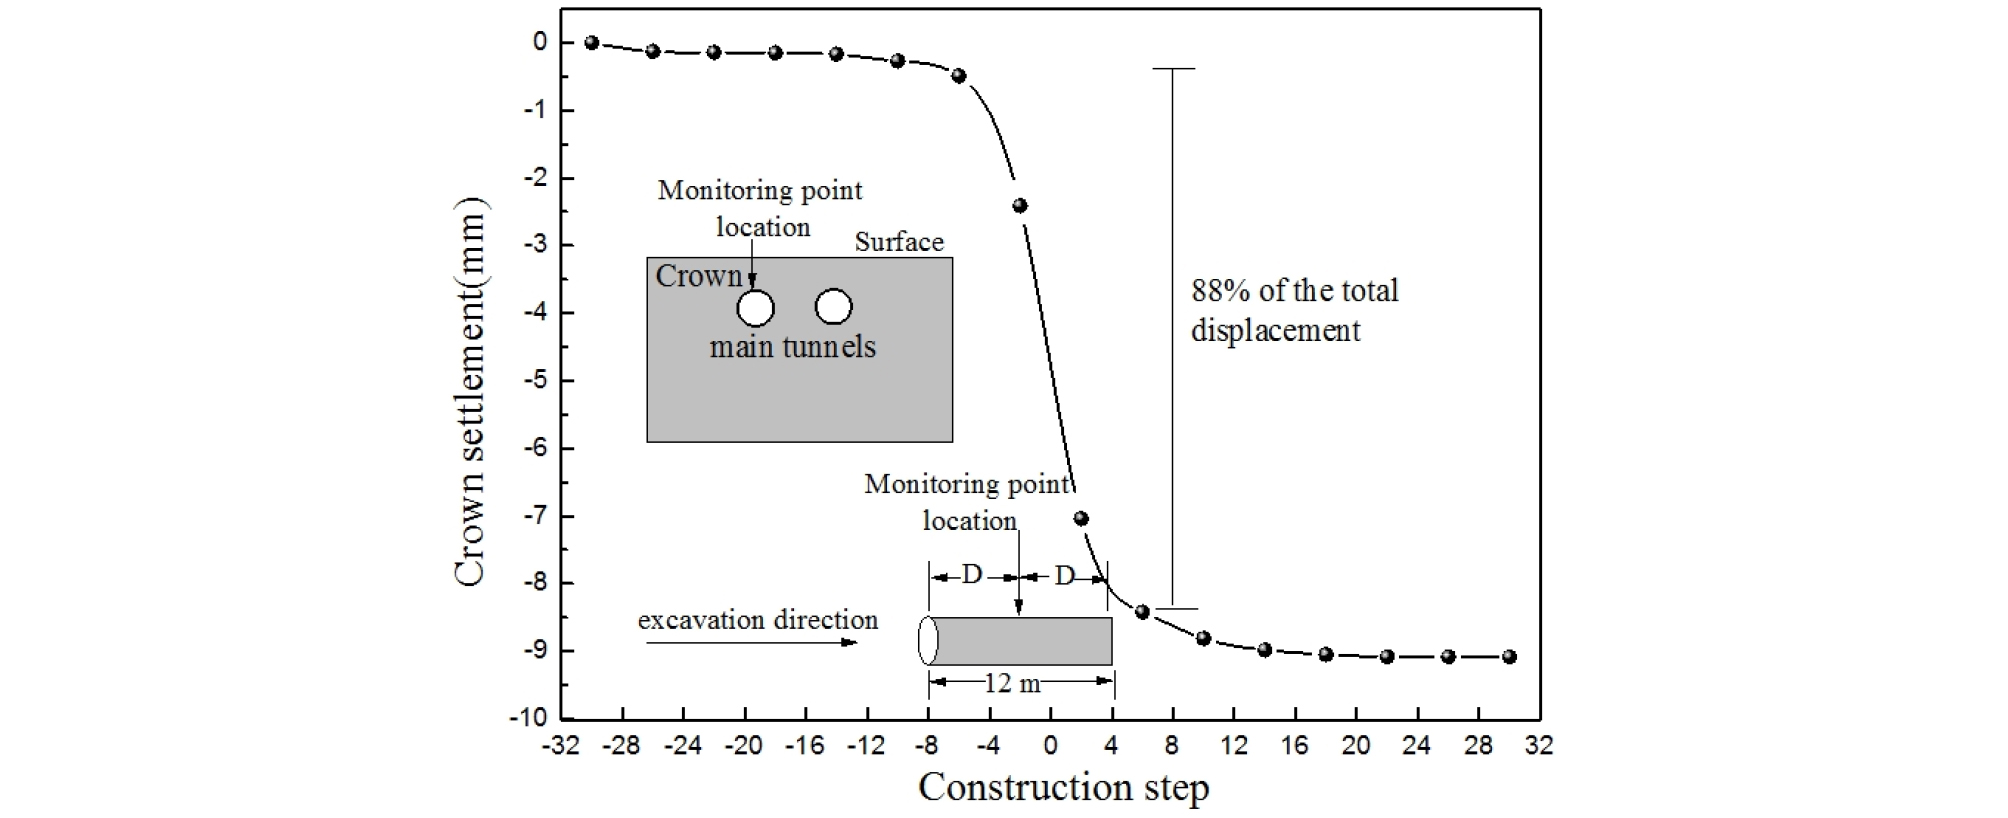
The crown settlement under different excavation steps is shown in Figure 5. As shown in Fig. 5, the settlement trend of the crown is consistent with the surface, the obvious difference is that the main settlement is concentrated in 12 to 18 steps, and the curve is steeper. This is mainly due to the fact that the tunnel crown is closer to the excavation face than the surface.
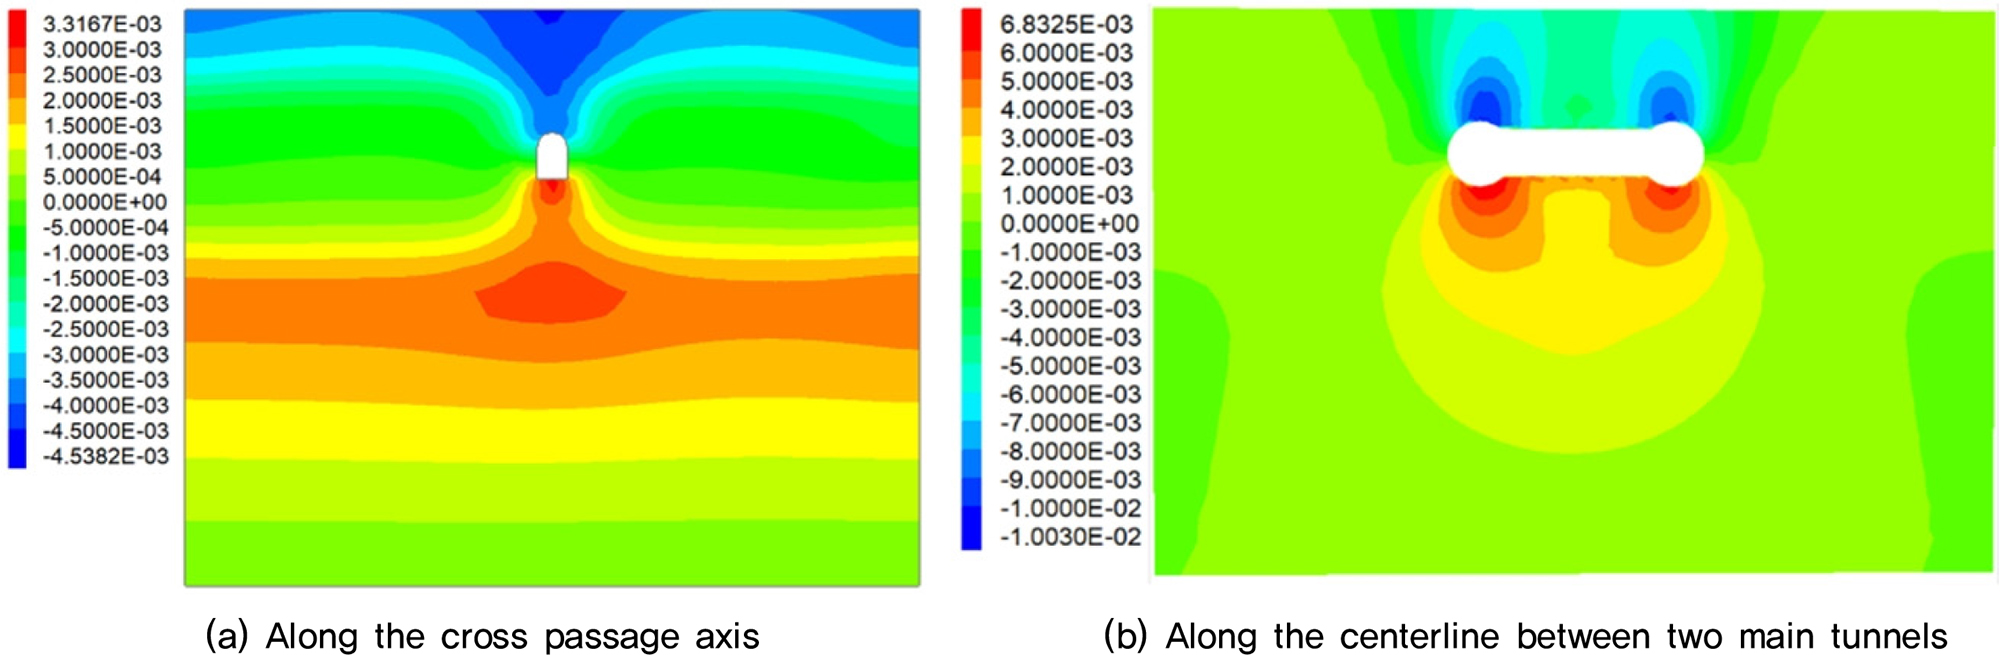
(2) After cross passage excavation
The cloud diagram of ground settlement after the completion of cross passage construction is shown in Figure 6. The curves of surface settlement under different direction are shown in Figure 7. As shown in Fig. 6(a) and 7(a), the cumulative surface settlement above the cross passage axis has the maximum value and the curve of surface settlement is "U" shape. As shown in Fig. 6(a) that surface settlement along the centerline between two main tunnels has greater variation compared with main tunnel axis, this is mainly because the overallity of the main tunnel is strong, and the disturbance is transmitted during the excavation of the cross passage. As shown in Fig. 6(b) and 7(b), the cumulative surface settlement in the position of 5 m from the centerline between two main tunnels has the maximum value and the curve of surface settlement is "W" shape. Since the cross passage is excavated from left to right, the settlement on the left side is larger than that on the right side. Surface settlement caused by cross passage excavation is mainly concentrated between two main tunnels and the maximum value is 5.61 mm while the maximum value after main tunnel construction is 5.06 mm, which shows that excavation of the cross passage will further increase the surface settlement.
In order to understand the influence of the construction of the cross passage on the settlement of the main tunnels, the construction steps are analyzed separately. As shown in Fig. 8, it can be seen from Figure 8 that the maximum crown settlement of the left main tunnel is gradually larger as the excavation progresses while the maximum crown settlement of right main tunnel remains unchanged before step 5 and followed by a slow increase, the settlement rate of the left main tunnel is gradually reduced due to the cross passage is excavated from left to right. At the same time, it is shown that after the completion of the cross passage excavation, the maximum settlement of crown of the left main tunnel is larger than that of the right main tunnel. Compared with step 0 (before the cross passage excavation), the crown settlement of the left and right main tunnels increased by 0.93 mm and 0.18 mm, respectively.

4.1.2 Stress
(1) After main tunnels excavation
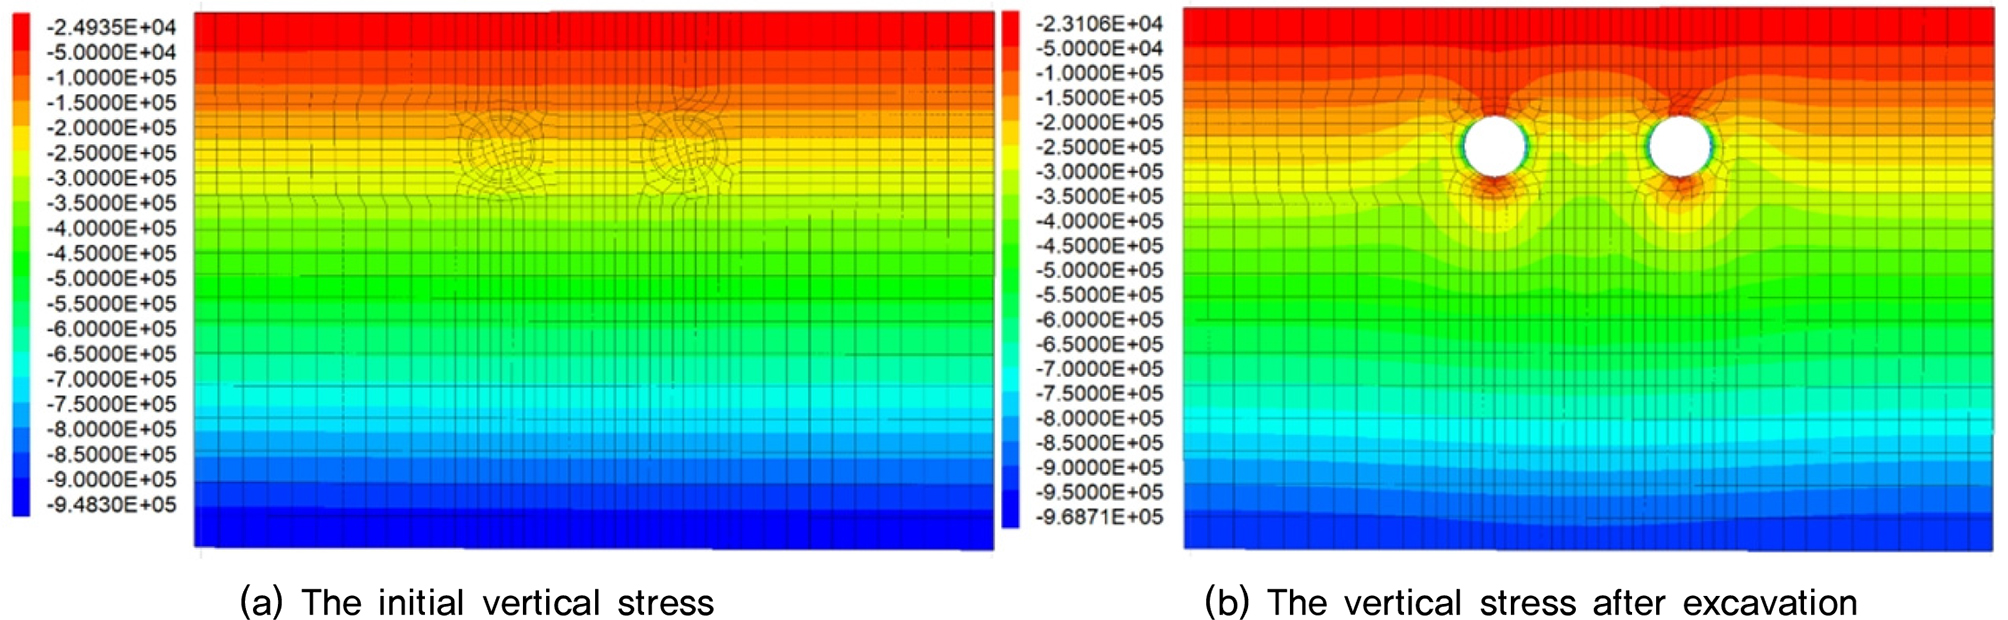
The initial vertical stress cloud picture and the vertical stress cloud picture after excavation are shown in Fig. 9. It is shown in Fig. 9 that the excavation of the tunnel causes the stress field of stratum to be redistributed, and the surrounding rock near the haunch of the main tunnels will have stress concentration. The vertical stress of the surrounding rock near the tunnel bottom and the crown is smaller than that of the same buried depth, but the vicinity of the haunch is larger than that of the same buried depth. This is because the support bears a part of the This is because the support bears a part of the stress release caused by excavation. and a certain deformation occurred in the bottom and the crown, so that the vertical stress is concentrated on the haunch.
(2) After cross passage excavation
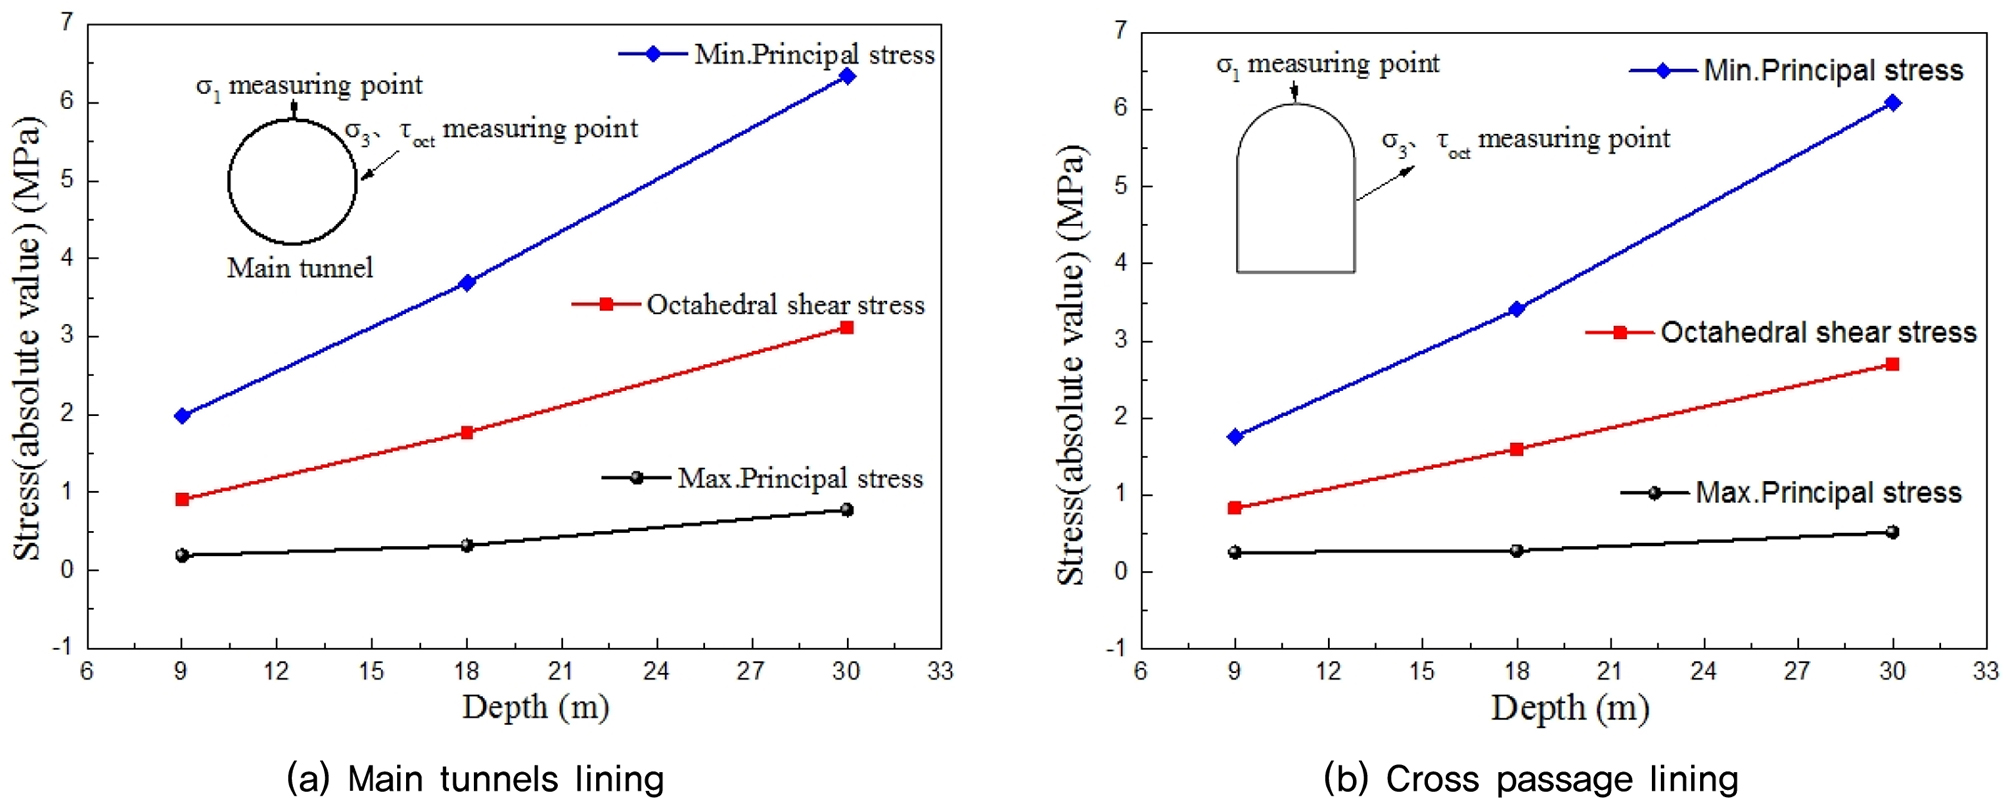
The stress contour of the main tunnel lining after cross-passage construction is shown in Figure 10. The stress value and max value position under different construction steps are shown in Tables 5, 6 and 7. The following characteristics can be seen:
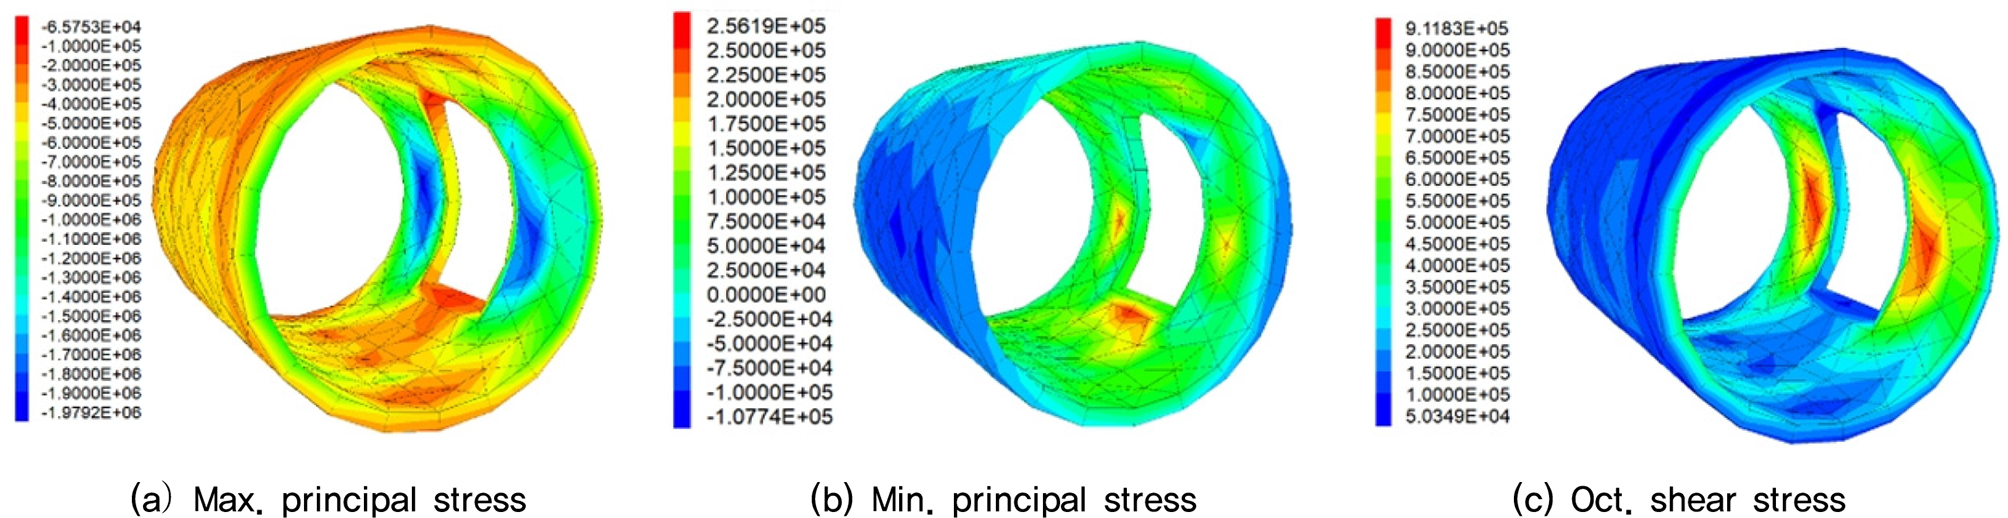
Table 5. Maximum principal stress of the main tunnels lining (MPa)
Table 6. Minimum principal stress of the main tunnels lining (MPa)
Table 7. Octahedral shear stress of the main tunnels lining (MPa)
① Before the cross passage excavation, the maximum value of max. principal stress appears in the main tunnels crown. After excavation, the maximum value appears on the bottom side of the opening side, and when the lining is removed (step 1), the stress value decreased, and then the maximum principal stress value gradually increased with the construction progress. The final maximum principal stress value was 0.26 MPa with an increase of 24%.
② Before the cross passage excavation, the maximum value of min. principal stress appears on the spring of main tunnels. After excavation, the maximum value is present on both sides of the opening side. At the time of the lining is removed (step 1), the stress value increased greatly. After the application of the support, the stress value decreased. Then, with the progress of the construction, the minimum principal stress value gradually increases, and the final minimum principal stress value is 1.98 MPa with an increase of 52%. The distribution law of octahedral shear stress is the same as the min. principal stress and the final octahedral shear stress is 0.91 MPa with an increase of 72%.
③ The excavation of the cross passage has the greater influence on the minimum principal stress and the octahedral shear stress, but has little effect on the maximum principal stress. Cross-passage excavation increases the maximum principal stress and minimum principal stress of the main tunnels lining, which increases the shear stress of the main tunnel lining.
④ As the cross passage is constructed, the stress redistribution occurs in the intersection lining, especially in the opening side lining. Ultimately, an unfavorable form of force that is pulled up by the upper and lower sections is produced. Therefore, the intersection part should be reinforced effectively and sufficient support should be implemented during construction.
4.2 Comparison of different depth
4.2.1 After main tunnels excavation
(1) Settlement
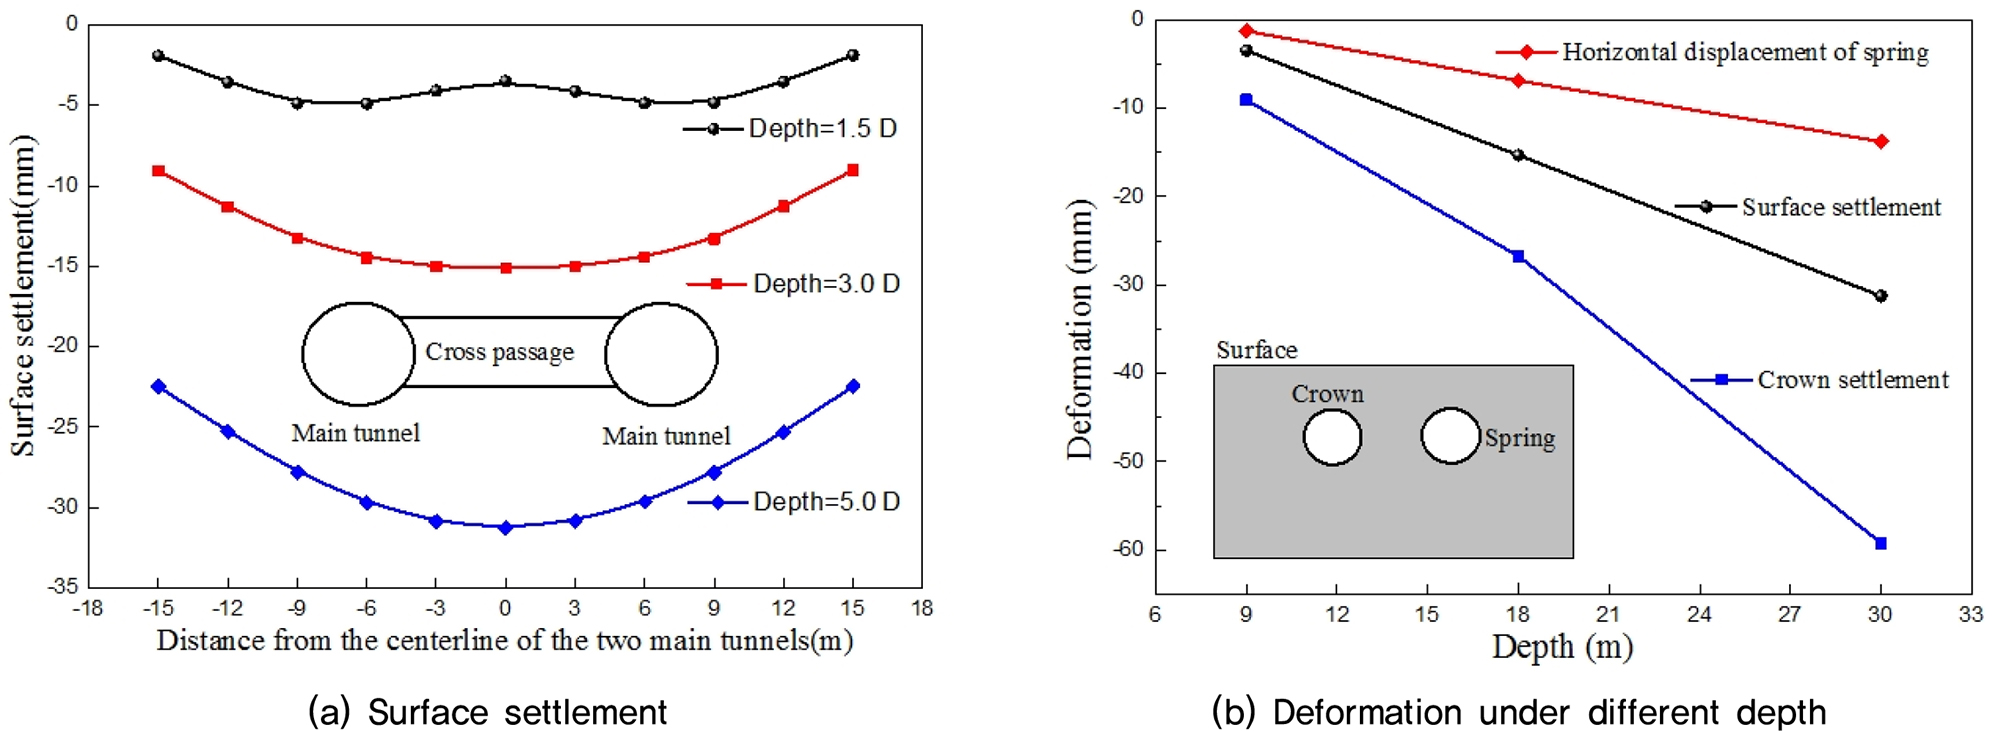
The stratum displacement contours under different buried depths after main tunnels excavation are shown in Fig. 11. It is shown in Fig. 11 that the maximum settlement of the surface with a depth of 1.5 D is located directly above the main tunnels, while the maximum settlement of the surface with a depth of 3.0 D and 5.0 D are located directly above the center-line of the two main tunnels. That is with the increase of the buried depth, the surface settlement caused by the construction of two parallel main tunnels gradually moves closer to the middle. The deformation values at different depths are shown in Fig. 12(b), it is shown in the figure that the horizontal convergence of main tunnels, the main tunnels settlement and the surface settlement increase with the increase of the buried depth, and it shows a clear linear relationship.
(2) Stress
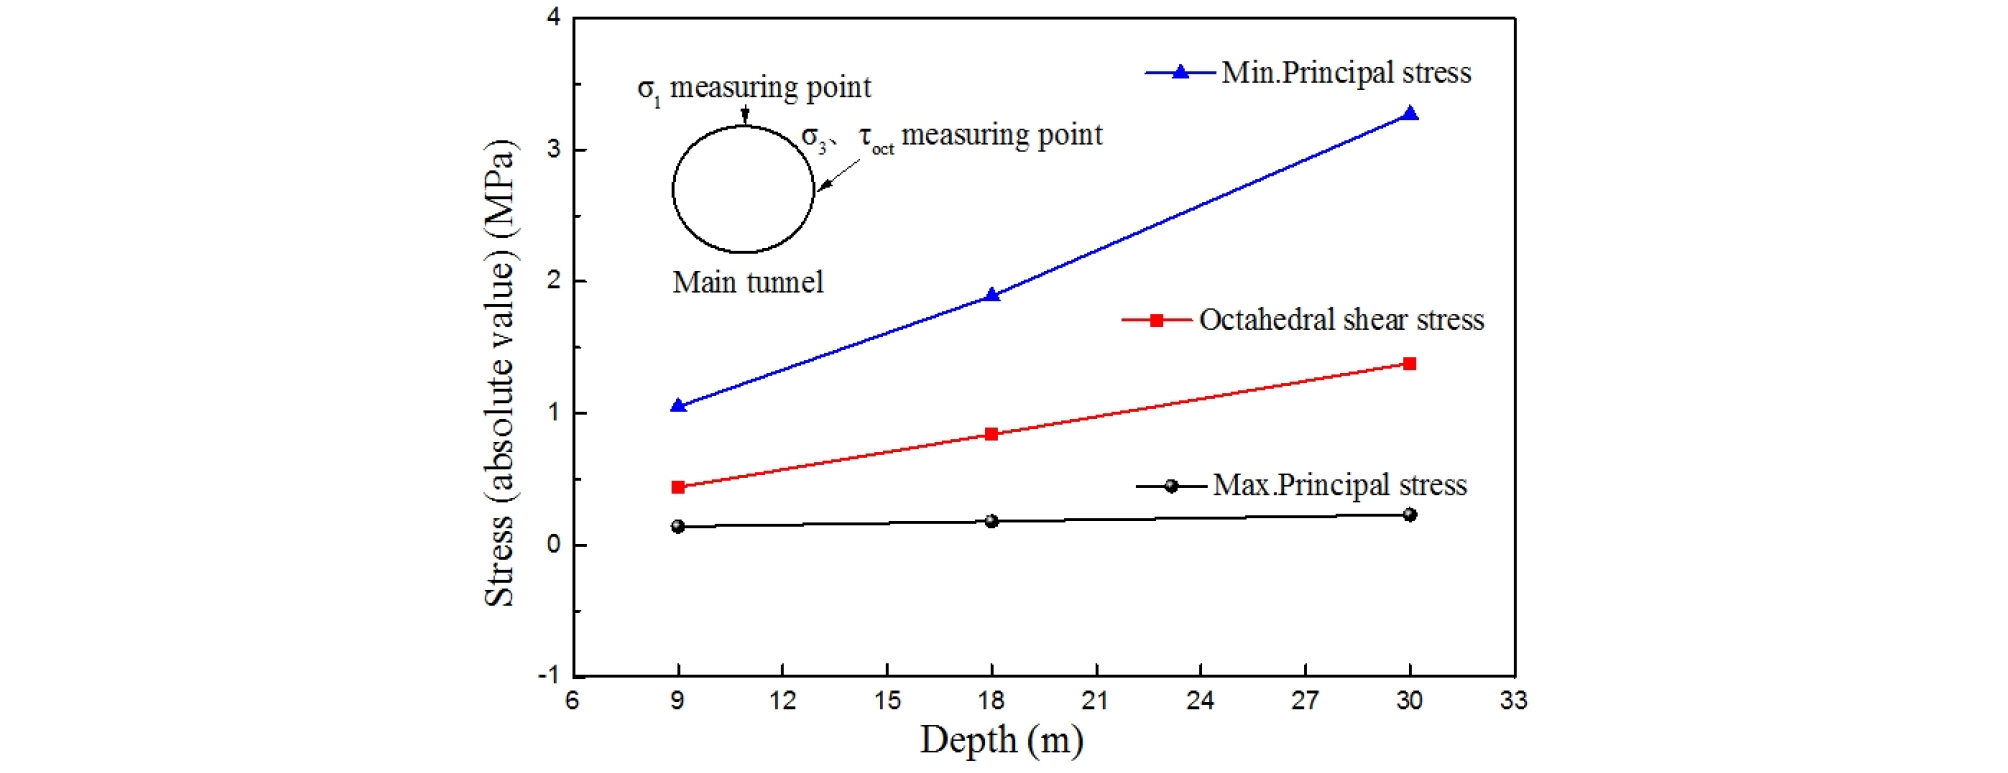
The maximum value of maximum principal stress occurred in the main tunnel crown while the maximum value of minimum principal stress and octahedral shear stress occur in the spring on the opposite side of the opening lining. So the maximum value is selected to analyze variations of main tunnel stress under different depth as shown in Fig. 13. It is shown in the figure that stress of the main tunnel increase with the increase of the buried depth, and the linear relationship is significant. Among them, with the increase of the buried depth, the change of the minimum principal stress is the largest, the change of the octahedral shear stress is second, and the change of the maximum principal stress is the smallest.
4.2.2 After cross passage excavation
(1) Settlement
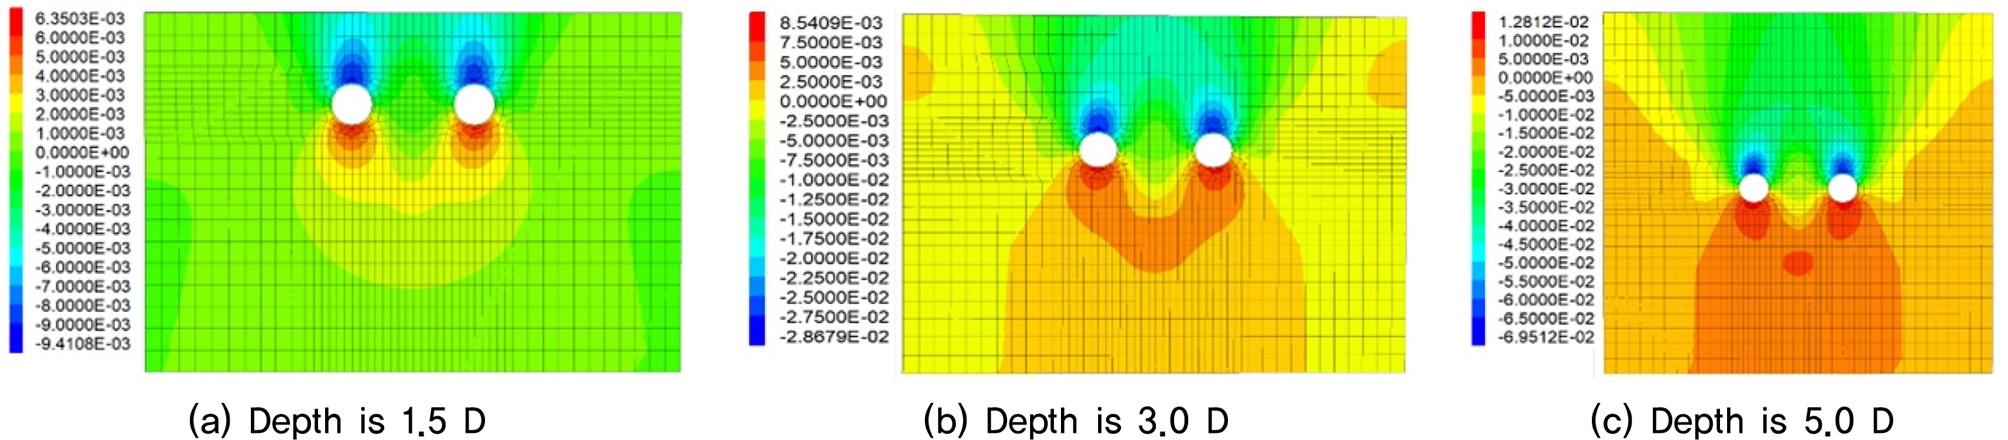
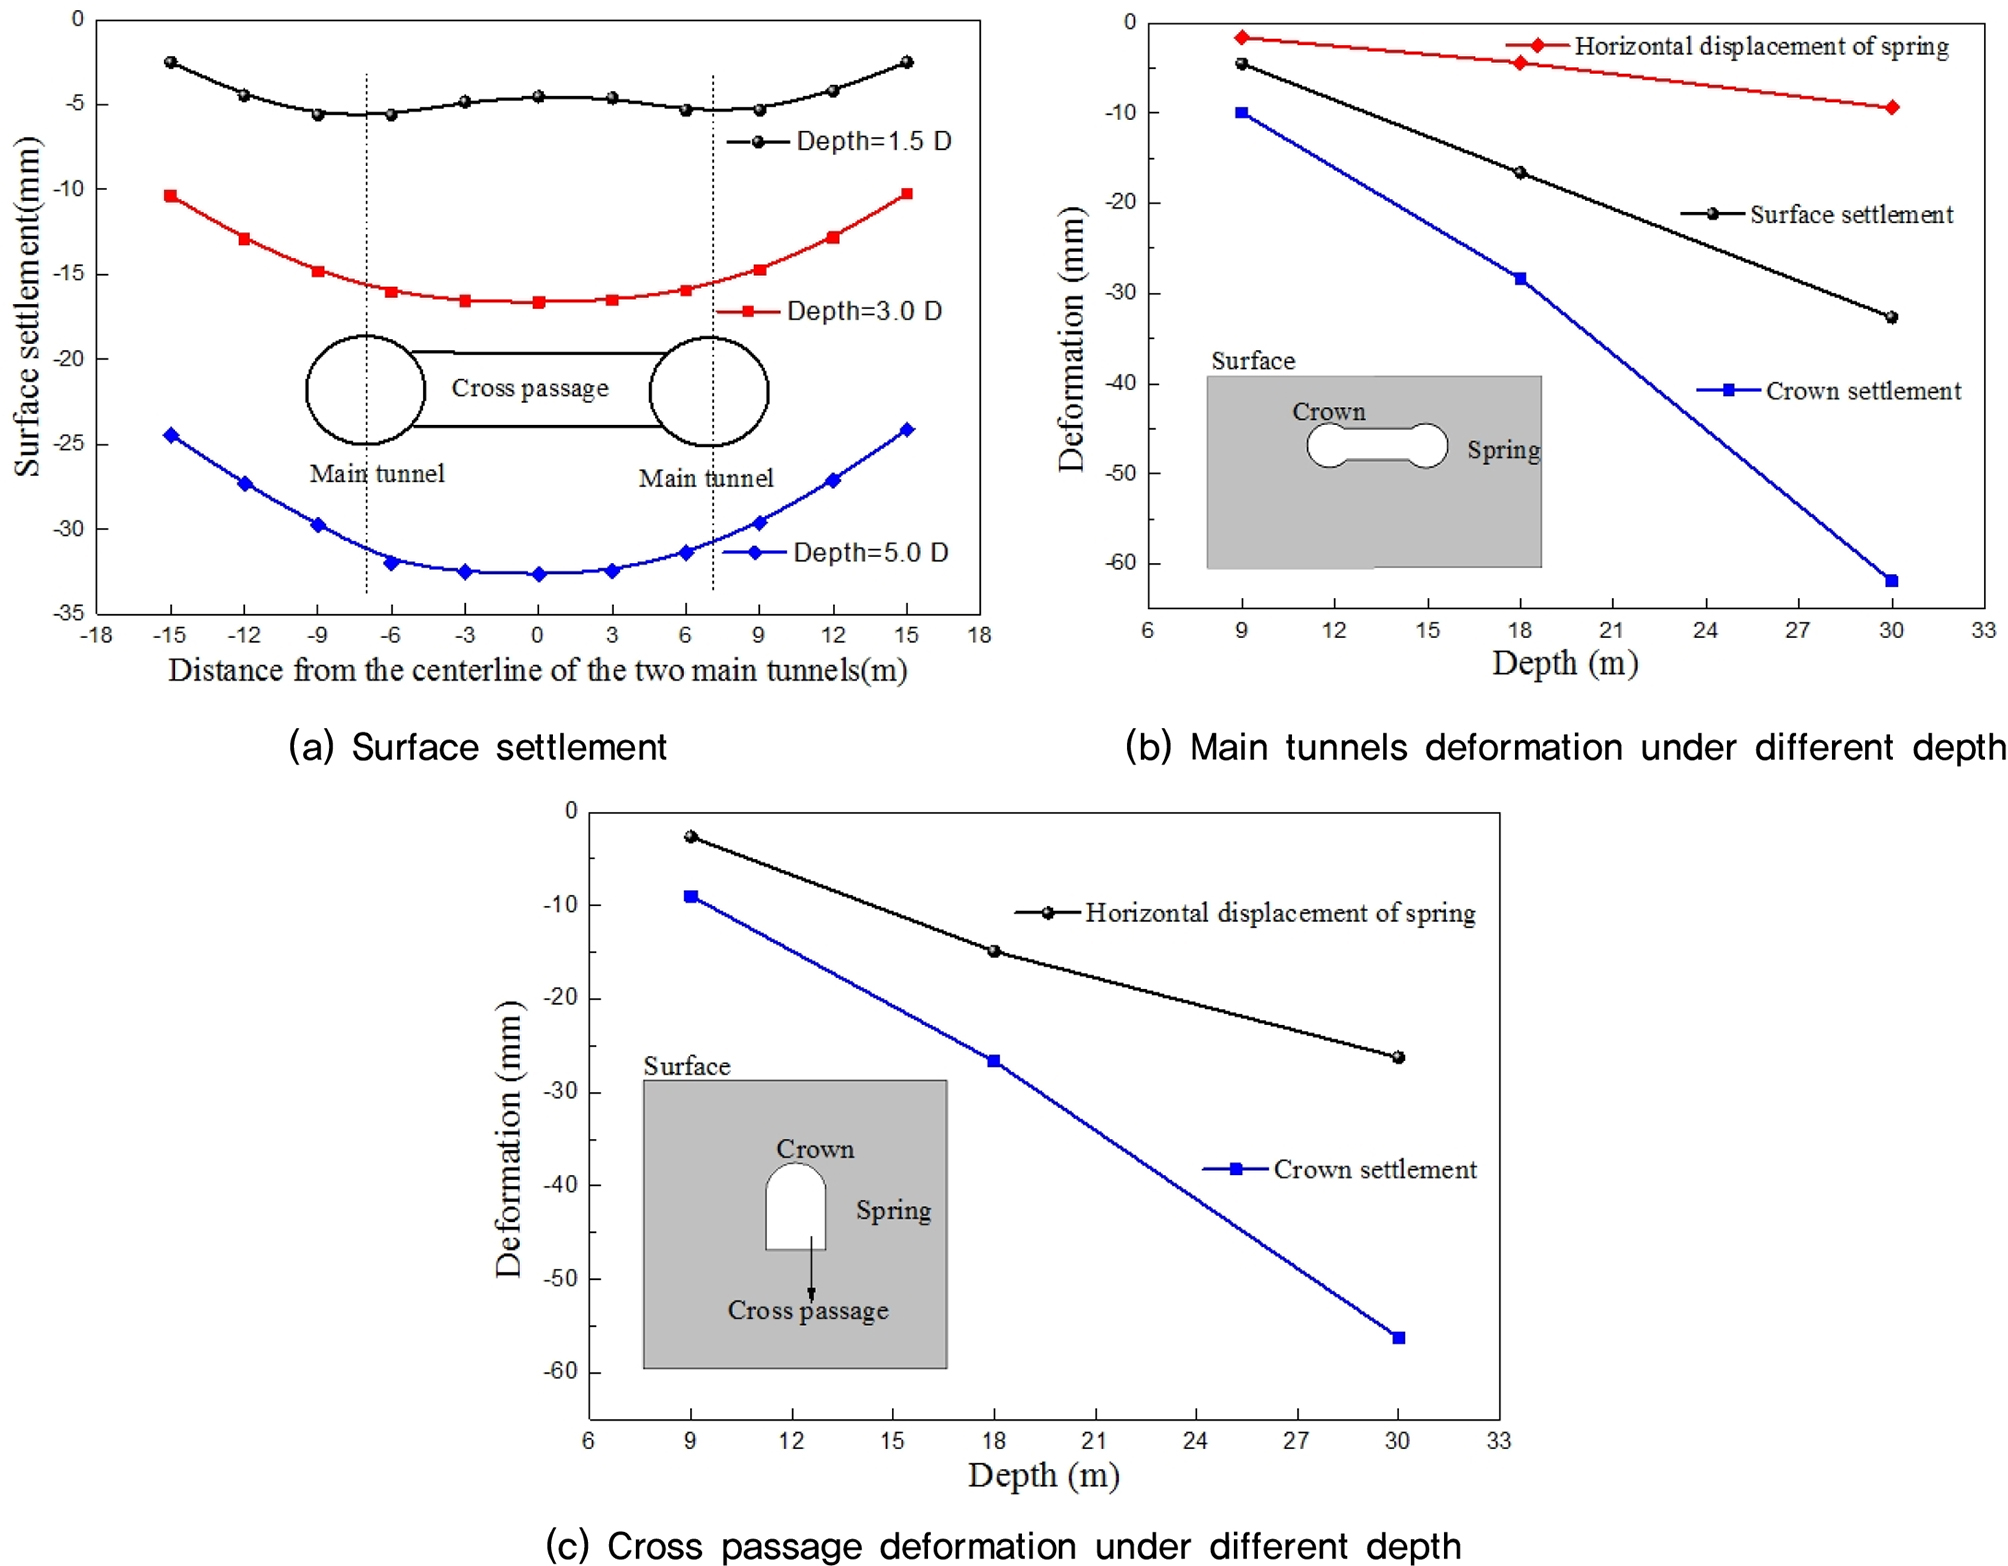
The variations of deformation under different buried depths after cross passage excavation are shown in Fig. 14. It is shown in Fig. 14(a) that the maximum settlement of the surface with a depth of 1.5 D is located directly above the main tunnels, while the maximum settlement of the surface with a depth of 3.0 D and 5.0 D are located directly above the center-line of the two main tunnels. It is shown in Figs. 14(b) and 14(c) that the deformation values of main tunnels and cross passage increase with the increase of the buried depth, and it shows a clear linear relationship. With the increase of the buried depth, the change of the crown settlement is the largest, the change of the surface settlement is second, and the change of the horizontal displacement is the smallest.
(2) Stress
The maximum value of stress of main tunnels and cross passage in the intersection part under different depth are shown in Fig. 15. It is shown in the figure that stress of the main tunnels and cross passage increase with the increase of the buried depth, and the linear relationship is significant. Among them, with the increase of the buried depth, the change of the minimum principal stress is the largest, the change of the octahedral shear stress is second, and the change of the maximum principal stress is the smallest.
4.3 Comparison of different spacing
4.3.1 After main tunnels excavation
(1) Settlement
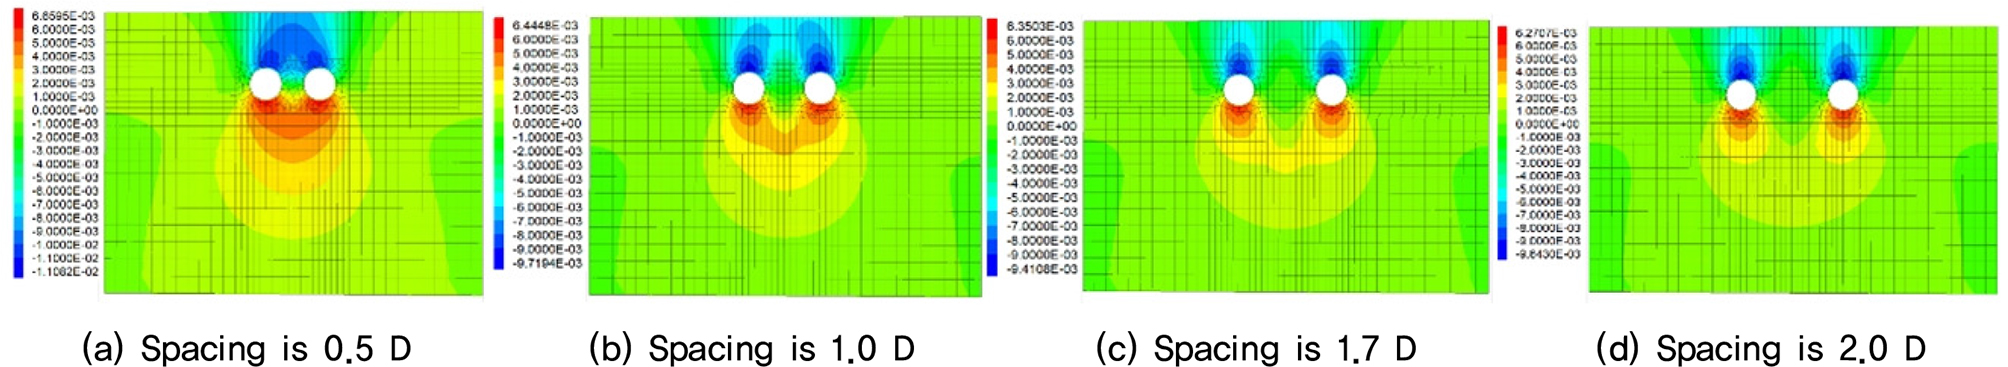
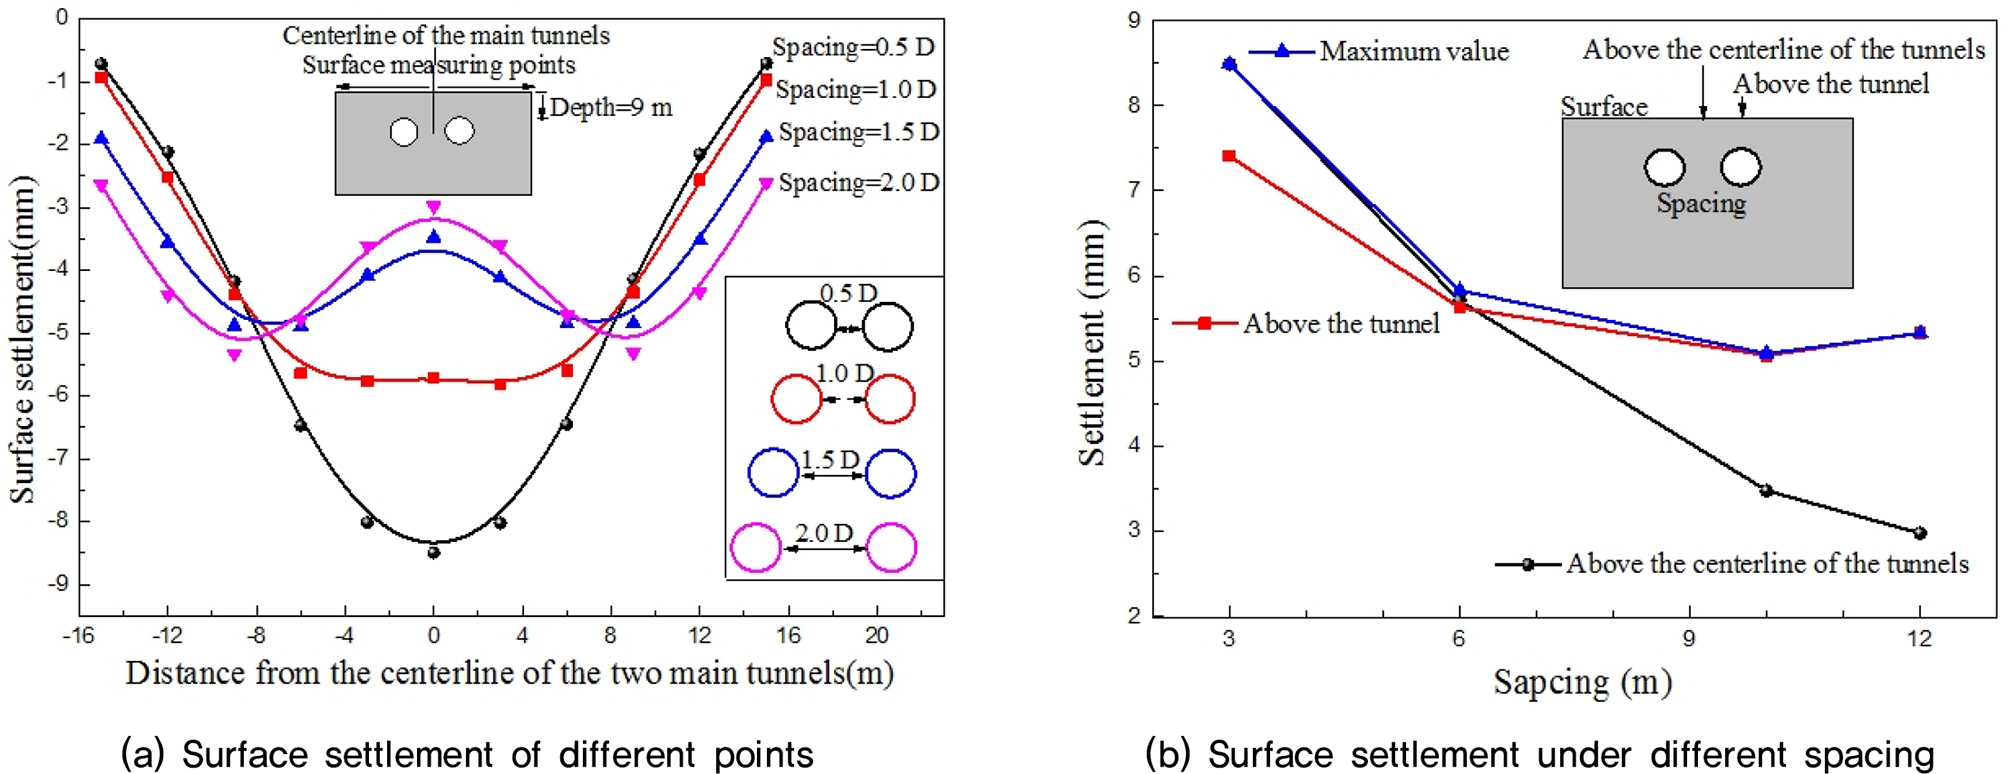
The displacement contours of the stratum under different buried spacing are shown in Fig. 16. It is shown in Fig. 16 that with the decrease of the spacing, the surface settlement caused by the construction of two parallel main tunnels gradually moves closer to the middle. When the spacings are 2.0 D and 1.7 D, the maximum surface settlement caused by tunnel excavation are above the main tunnels while the maximum surface settlement under the spacings of 0.5 D and 1.0 D are above the center-line of main tunnels.
The surface settlement along the centerline of the two main tunnels under different tunnel spacing is shown in Fig. 17(a). It is shown in the figure that as the tunnel spacing increases, the influence range of surface settlement caused by tunnel excavation gradually increases, and the maximum surface settlement gradually increases. The settlement variations at different spacing are shown in Fig. 17(b), it is shown in the figure that with the increase of the spacing, the surface settlement above the centerline of the main tunnels decrease but gradually slowing down, and the surface settlement above the main tunnels axis gradually decrease first, then increase slightly. This is because as the tunnels spacing increases, the interaction between two main tunnels gradually decreases to zero.
(2) Stress
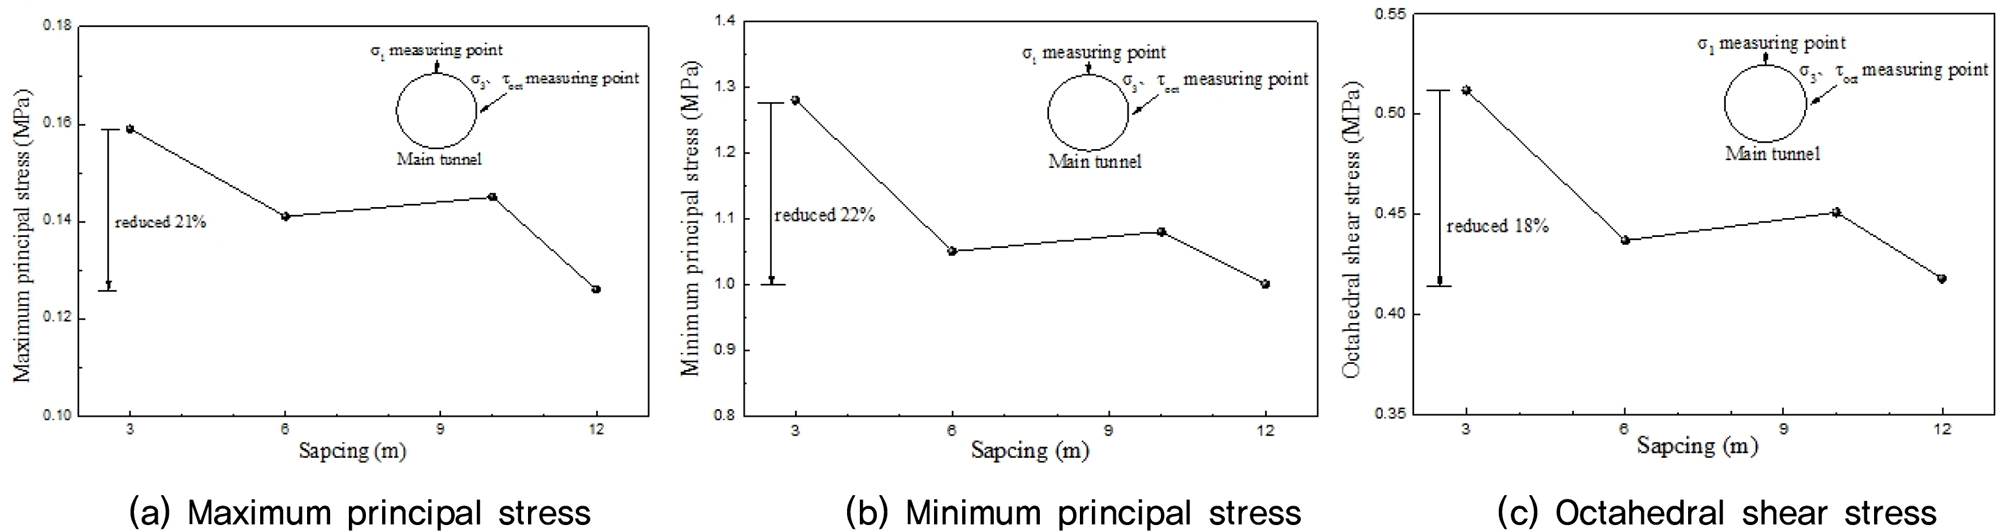
The variation curve of maximum principal stress, minimum principal stress and octahedral shear stress with tunnel spacing is shown in Fig. 18. It is shown in the figure that as the tunnel spacing increases, each stress value first decreases then increases and then decreases, but the amount of change is not large. In the process of increasing the spacing from 0.5 D to 2.0 D, the biggest change is the minimum principal stress, which change from -1.28 MPa to -1.00 MPa with a decrease of 22%. It is shown that the increase of tunnel spacing has little effect on the stress of the main tunnel lining structure.
4.3.2 After cross passage excavation
(1) Settlement
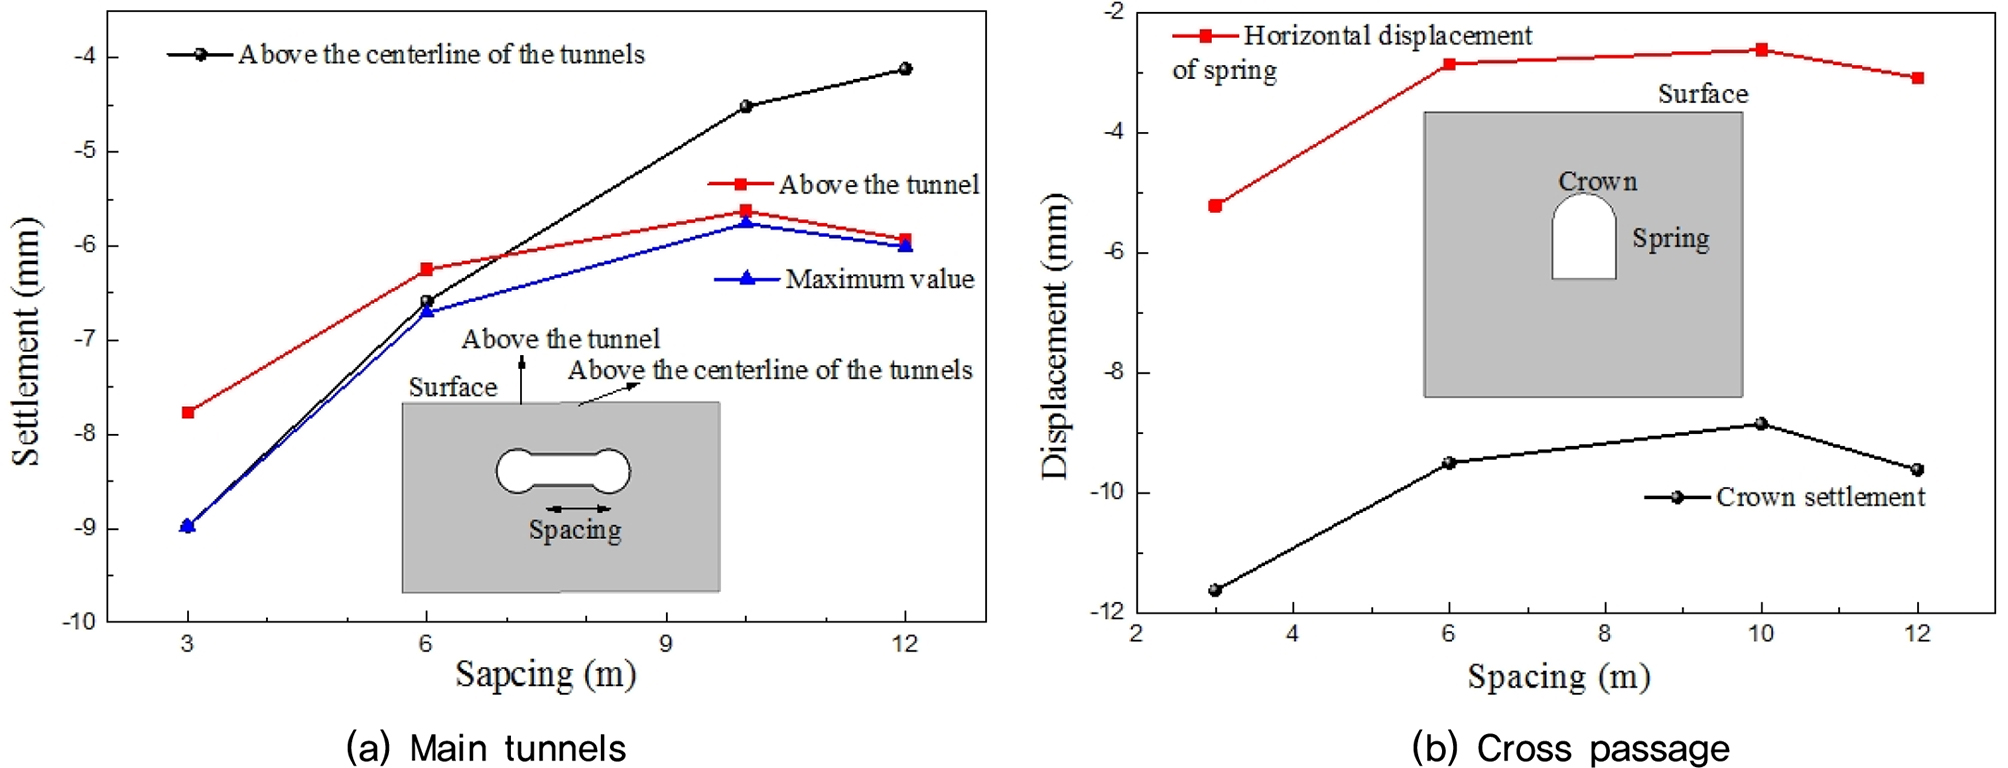
The settlement after cross passage excavation under different spacing are shown in Fig.18. It is shown in Fig. 19 that since the cross passage is one-sided excavation, the settlement on the side of the first construction is larger than that on the other side.
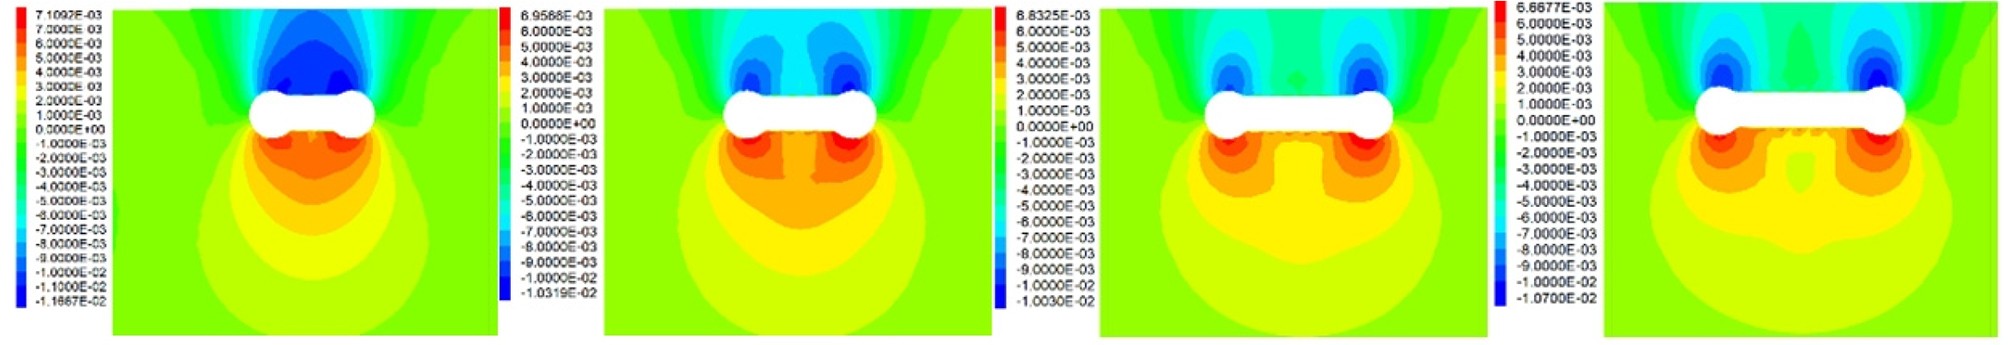
The settlement variations of main tunnels and cross passage at different spacing are shown in Fig. 20, it can be seen from the figure that with the increase of the spacing, the surface settlement above the centerline of the main tunnels decrease but gradually slowing down, and the surface settlement above the main tunnels axis and cross passage displacement gradually decrease first, then increase slightly. This is because as the tunnels spacing increases, the interaction between two main tunnels gradually decreases to zero.
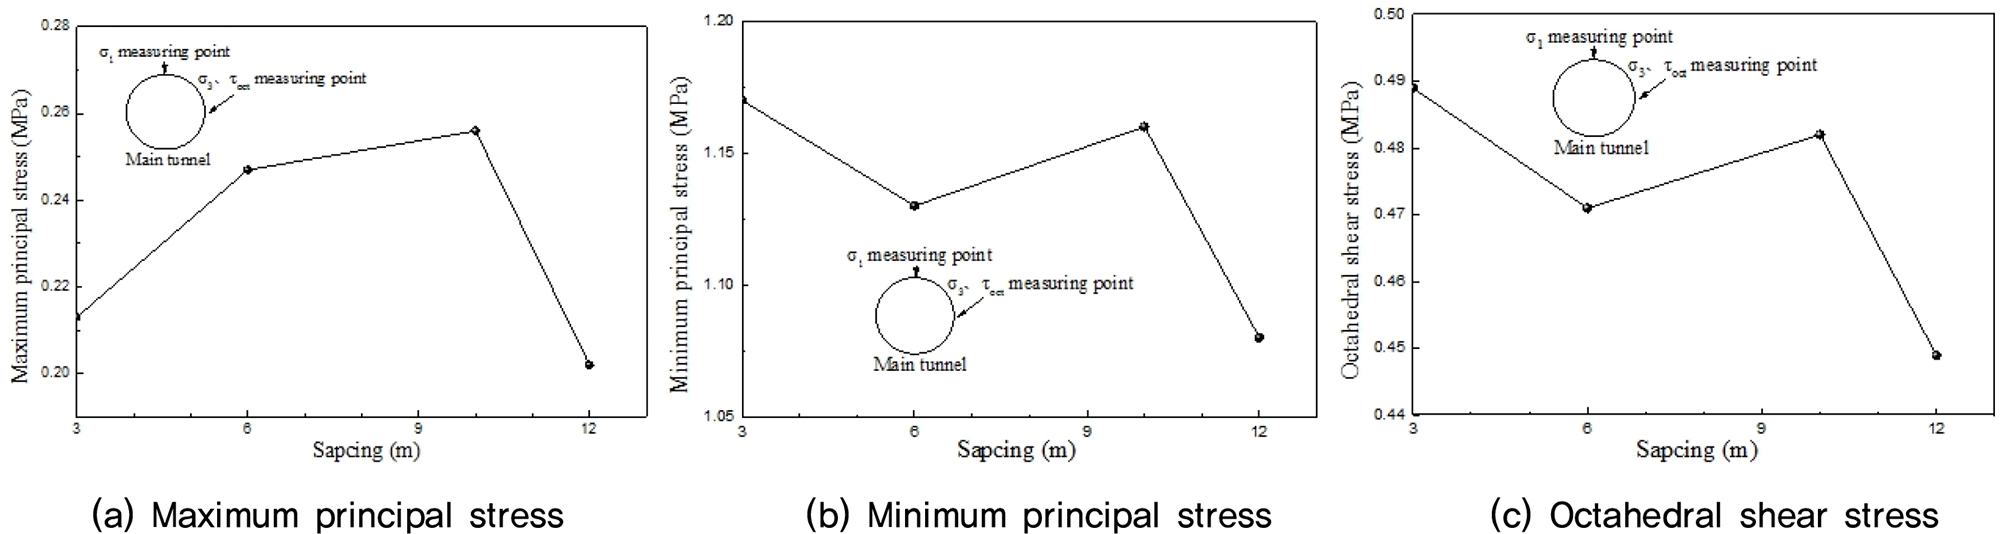
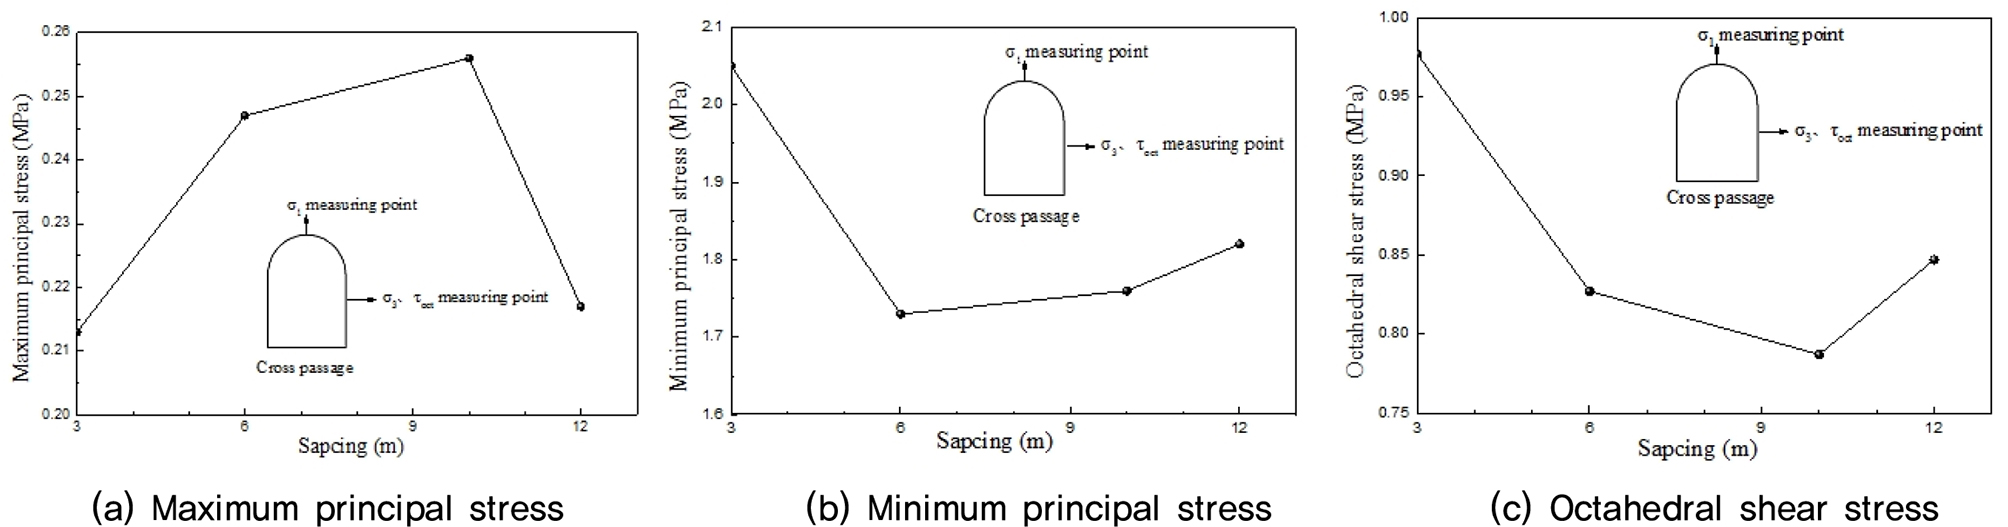
(2) Stress
The variation stress of main tunnels and cross passage are shown in Fig. 21 and Fig. 22, respectively. It is shown in Fig. 21 that as the tunnel spacing increases, maximum principal stress increases first and then decreases, but the amount of change is very small. It is shown in Fig. 22 that as the tunnel spacing increases, maximum principal stress increases first and then decreases, however, the change in minimum principal stress and octahedral shear stress is just the opposite.
5. Conclusion
The mechanical characteristic analysis and different parameter analysis of the main tunnel and cross passage construction are studied using FLAC3D. The main conclusions are summarized as follows.
(1) Surface settlement caused by cross passage excavation is mainly concentrated between two main tunnels and the excavation of the cross passage will further increase the surface settlement.
(2) As the cross passage is constructed, the stress redistribution occurs in the intersection lining, especially in the opening side lining. Ultimately, an unfavorable form of force that is pulled up by the upper and lower sections is produced.
(3) The excavation of the cross passage has the greater influence on the minimum principal stress and the octahedral shear stress, but has little effect on the maximum principal stress.
(4) The stress and displacement of the main tunnels and cross passage increase with the increase of the buried depth, and the linear relationship is significant. The increase of the buried depth has the greater influence on the minimum principal stress, but has little effect on the maximum principal stress.
(5) As the main tunnels spacing increases, the influence range of surface settlement caused by tunnel excavation gradually increases, and the maximum surface settlement gradually increases.
(6) Since the increase of the tunnel spacing reduces interaction, but increases the length of the cross passage, and correspondingly increases the construction time of the cross passage, so the stress variation of the main tunnel and the cross passage is complicated. But overall, the variation of the tunnels spacing has little effect on the stress of the tunnels lining.
