

1. Introduction
2. Engineering Background
2.1 Project Overview
2.2 Construction Process and Application of Reverse Circulation Drilling (RCD) Method
3. Data Analysis
3.1 Measured Data
3.2 Results Analysis
4. Conclusions
1. Introduction
In the realm of civil engineering, especially in large-scale infrastructure projects such as bridges, tunnels, and underground construction, the geological conditions encountered during excavation are critical to the project’s success. The classification of rocks based on their physical and mechanical properties plays a vital role in determining excavation methods, equipment, timelines, and safety measures. The accurate assessment of these properties helps optimize the construction process, ensuring both efficiency and safety in challenging environments.
Over the years, various rock classification methods have been developed to better understand and predict the behavior of different rock types during construction. Among the most widely used systems is the Rock Mass Rating (RMR) system, introduced by Bieniawski (1973, 1989), which incorporates parameters such as uniaxial compressive strength (UCS), rock quality designation (RQD), joint conditions, and groundwater conditions to classify rock masses. This system has proven effective in estimating the stability and load-bearing capacity of rock formations under different excavation conditions. Another significant classification method is the Q-system, proposed by Barton et al. (1974), which evaluates rock mass quality using parameters such as RQD, joint set numbers, and stress reduction factors. The Q-system is commonly used in tunneling and underground excavations due to its ability to provide practical guidelines for support design based on rock mass quality. In addition, the Hoek-Brown failure criterion (Hoek and Brown, 1980; Hoek, 1983) offers an empirical approach for estimating rock strength, taking into account both intact rock properties and the degree of fracturing. This method has been widely adopted in slope stability analyses and underground excavation design, especially in challenging geological environments.
Building upon the traditional rock classification methods, numerous scholars have analyzed certain properties of rocks (Aydan and Kawamoto, 2000; Kayabasi et al., 2003; Khabbazi et al., 2013). In addition to the widely used classification methods mentioned above, researchers have also innovatively employed other rock classification methods. Galbraith and Saunders (1983) classified lithological types using radiometric methods. In 1984, Williamson (1984) introduced the Unified Rock Classification System (URCS), which primarily considers four fundamental physical properties: weathering, strength, discontinuity, and density. Huang et al. (2013) developed a computer-assisted automatic classification system that takes into account seven parameters along with corresponding weights. With the continuous development of machine learning, Ran et al. (2019) proposed a method for accurate identification of field rock types based on deep convolutional neural network image analysis. Su et al. (2020) introduced a cascaded convolutional neural network (Con-CNN) approach for classifying geological rock types based on petrographic thin sections. Zhou et al. (2023) proposed and implemented a novel CNN, named HKUDES_Net, to classify seven common rock types in Hong Kong. Meanwhile, artificial neural networks have also been applied to classify surrounding rock masses in mountainous tunnel environments (Hasegawa et al., 2019).
While these rock classification methods have significantly contributed to our understanding of rock behavior in various geological environments, they primarily focus on static properties, such as uniaxial compressive strength, rock quality designation, and joint conditions. However, in large-scale infrastructure projects, especially during dynamic excavation processes, other parameters such as excavation speed and tool wear rate are crucial for evaluating rock performance under construction conditions. This paper presents a classification analysis of rocks based on measured excavation data from a construction project, combined with physical properties such as uniaxial compressive strength and applied point load. This study will help engineers and construction managers make informed decisions in future projects, improving both operational efficiency and safety.
2. Engineering Background
2.1 Project Overview
The data is obtained from the pile construction process for bridge in South Korea. The project involves significant foundation work using cast-in-place piles, requiring careful analysis of the geological conditions to ensure the stability of the piles and the overall structure. The piles, drilled using Reverse Circulation Drilling (RCD) methods, were installed both onshore and offshore, where rock excavation posed significant challenges. Understanding the properties of the underlying rock formations became essential for the project’s success.
Fig. 1 presents the overall layout of the construction project, visually displaying the distribution of piles and the general project planning. To gain a clearer understanding of the specific conditions of the pile foundation construction, Table 1 and Table 2 provide detailed information on the pile foundation data for different offshore and onshore areas, including key details such as the number, length, and specifications of the piles.
The Sections mentioned in Tables 1 and 2 (e.g., AP1, PY1) represent different areas of the pile construction project, where each section corresponds to specific zones in the onshore or offshore construction sites. The specific location of the pile is shown in Fig. 1.
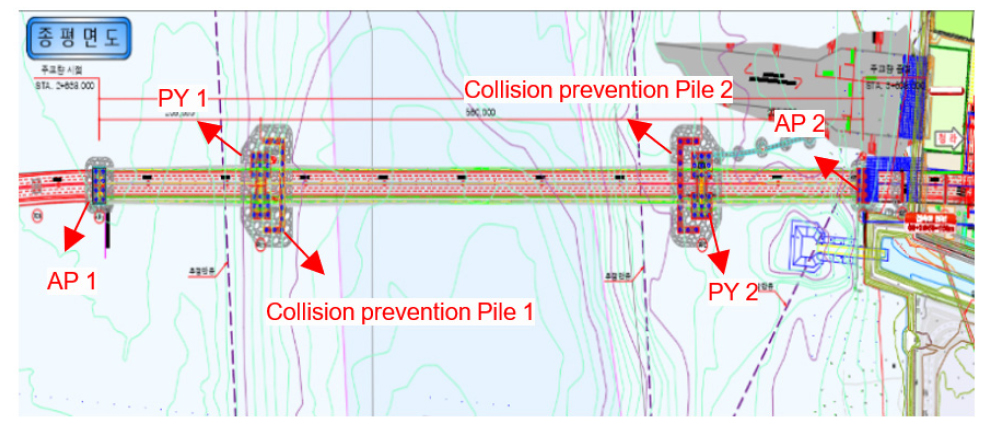
Table 1.
Offshore pile specifications (D 3000)
Table 2.
Onshore pile specifications (D 3000)
| Section | Quantity | Pile Length (m) |
| P27 | 2 | 45 |
| P28 | 2 | 50 |
| P29 | 2 | 49 |
| P30 | 2 | 50 |
| P31 | 2 | 59 |
| P32 | 2 | 72 |
| P33 | 2 | 65 |
| P34 | 3 | 57.5 |
| P35 | 3 | 46.5 |
| P36 | 3 | 42.3 |
| Subtotal | 23 |
2.2 Construction Process and Application of Reverse Circulation Drilling (RCD) Method
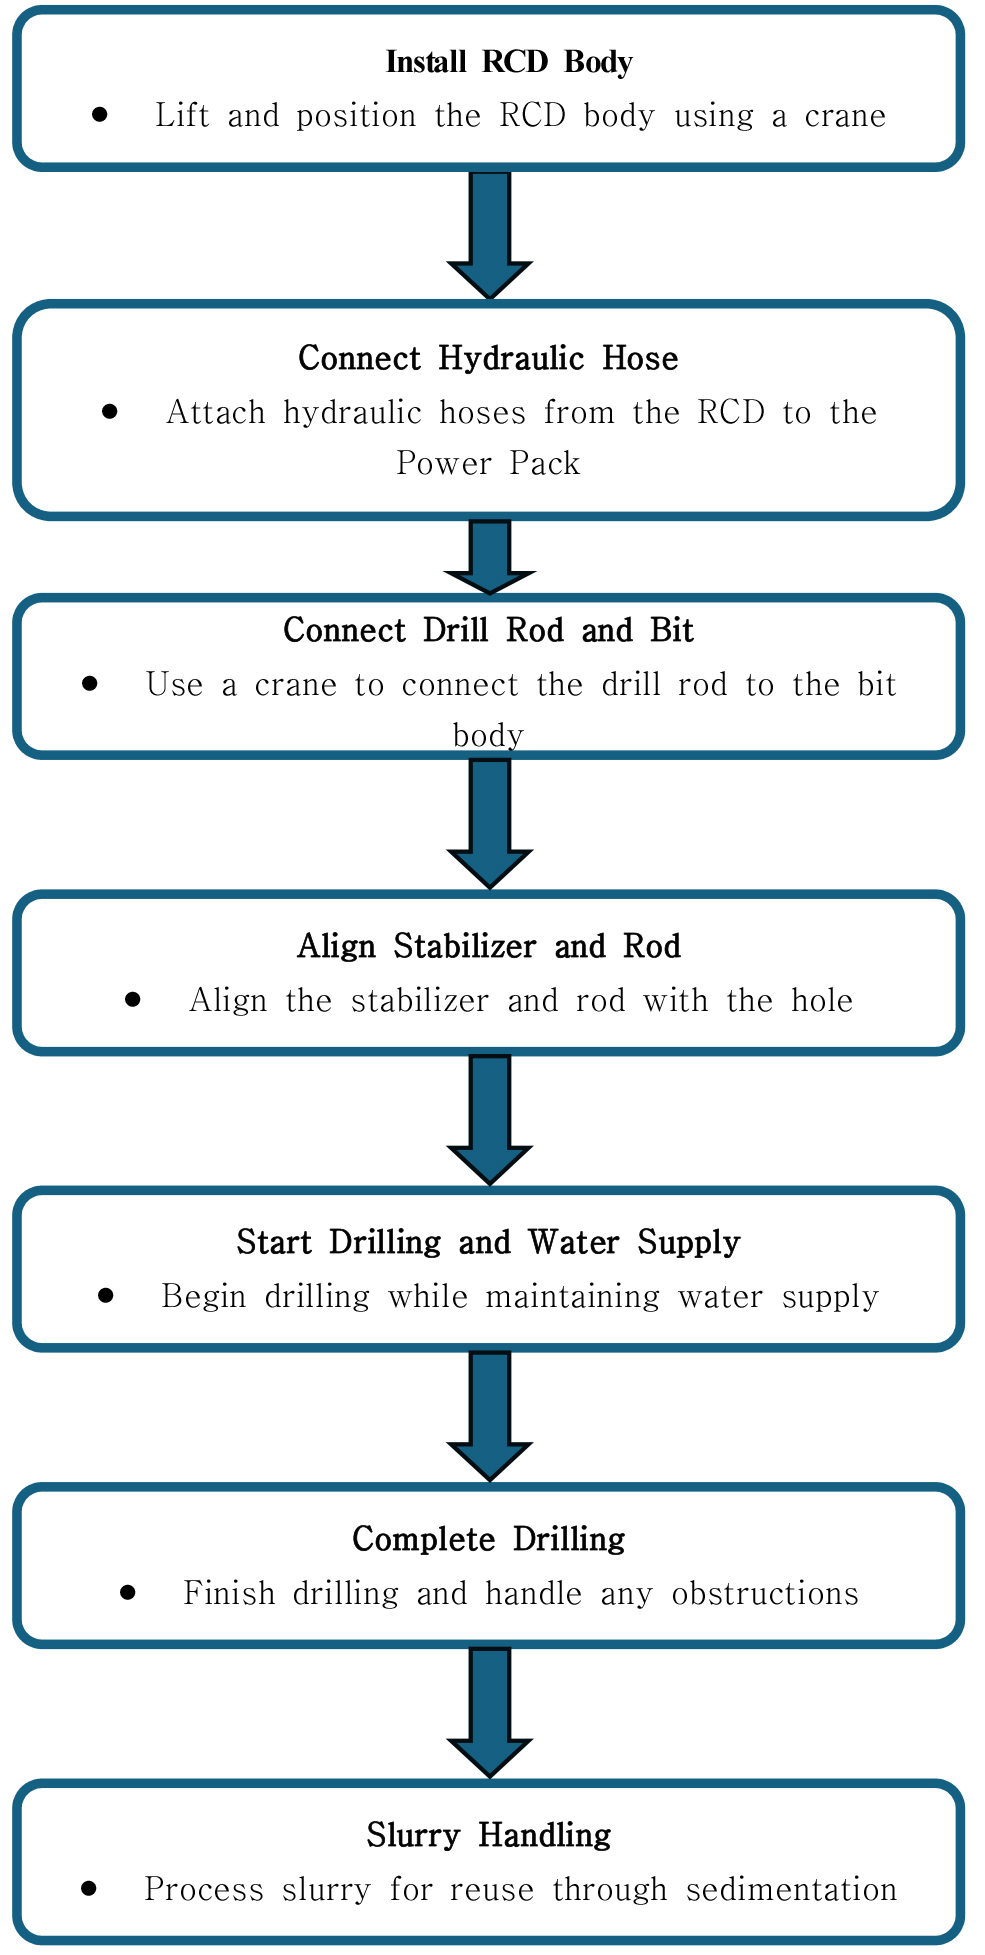
The Reverse Circulation Drilling (RCD) method is a widely used construction technique, especially suitable for the construction of large-diameter piles. The process involves several steps, including equipment installation, connecting drill rods, drilling operations, and slurry handling. To provide a clearer understanding of this complex procedure, Fig. 2 outlines the RCD construction process.
The excavation for the cast-in-place piles required traversing through various rock layers, each with distinct physical and mechanical properties. The construction team encountered varying degrees of rock hardness, from weathered soft rocks to harder, more intact rock formations. For this project, the primary challenges were related to accurately predicting the behavior of the rock layers under load and during excavation. The design and installation of the piles required a detailed understanding of the rock’s ability to support the loads imposed by the structure. The uniaxial compressive strength (UCS), a key metric used in rock classification, was essential in determining how the rock would perform under vertical loads. It measures the maximum compression stress a rock can withstand before failure. UCS values are vital in determining the overall hardness and stability of a rock layer. Harder rocks, such as granite or basalt, which exhibit higher UCS values, often require more robust and sophisticated excavation methods, such as specialized drilling techniques and heavy-duty equipment. On the other hand, softer rocks, such as weathered sandstone, tend to have lower UCS values and can be excavated more quickly, though they may require additional structural support to ensure stability.
This study classifies the rock layers encountered in the construction project based on excavation speed, combined with uniaxial compressive strength (UCS) and point load strength. By examining these parameters, the study aims to develop a comprehensive rock classification framework that can be applied to future projects involving complex geological conditions. This classification not only helps optimize excavation strategies but also improves the accuracy of load-bearing predictions, ensuring the safety and cost-effectiveness of large-scale infrastructure projects.
3. Data Analysis
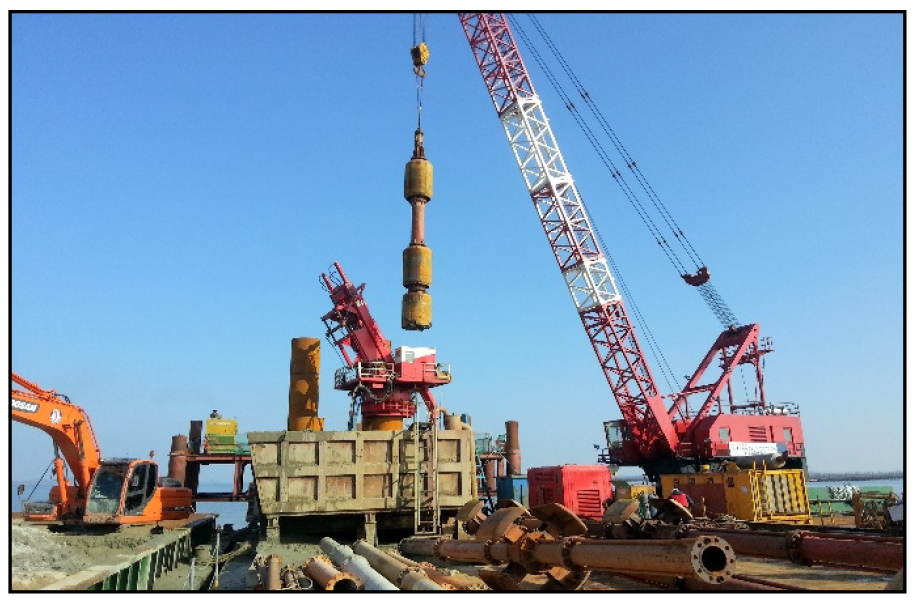
The primary construction method in this project involves foundation excavation using RCD (Reverse Circulation Drilling) (Fig. 3), along with the use of a Vibro Hammer and Hammer Grab for driving and excavating steel pipe piles. A total of 101 cast-in-place piles with a D3000 specification were constructed in both offshore and onshore areas. The project deals with complex geological conditions, including weathered rock layers, soft rock layers, and hard rock layers. Analyzing the measured data from the construction process is crucial for evaluating foundation stability and pile load-bearing capacity.
Fig. 3 illustrates the excavation process using the Reverse Circulation Drilling (RCD) method, particularly focusing on the drilling and rock layer handling phase with the support of water supply.
3.1 Measured Data
The project monitored the RCD excavation depth and corresponding excavation speed, while also conducting tests on the point load strength and uniaxial compressive strength of the excavated rock. To more intuitively demonstrate the variation in excavation speed with depth during the excavation process, a graph depicting the relationship between excavation speed and depth was plotted based on the measured data (Fig. 4).
Fig. 4 shows the variation in excavation speed with depth during the excavation process for piles in different areas. This figure clearly reflects the excavation difficulty at different depths, helping us to better understand the distribution of rock layers and their impact on the excavation process. As the figure shows, excavation speed gradually decreases with increasing depth, indicating that the hardness and strength of the rock layers significantly affect the excavation speed. To further analyze the effect of uniaxial compressive strength on the excavation speed, based on the experimental data carried out in the project, the relationship between uniaxial compressive strength and excavation speed can be obtained as shown in Fig. 5.
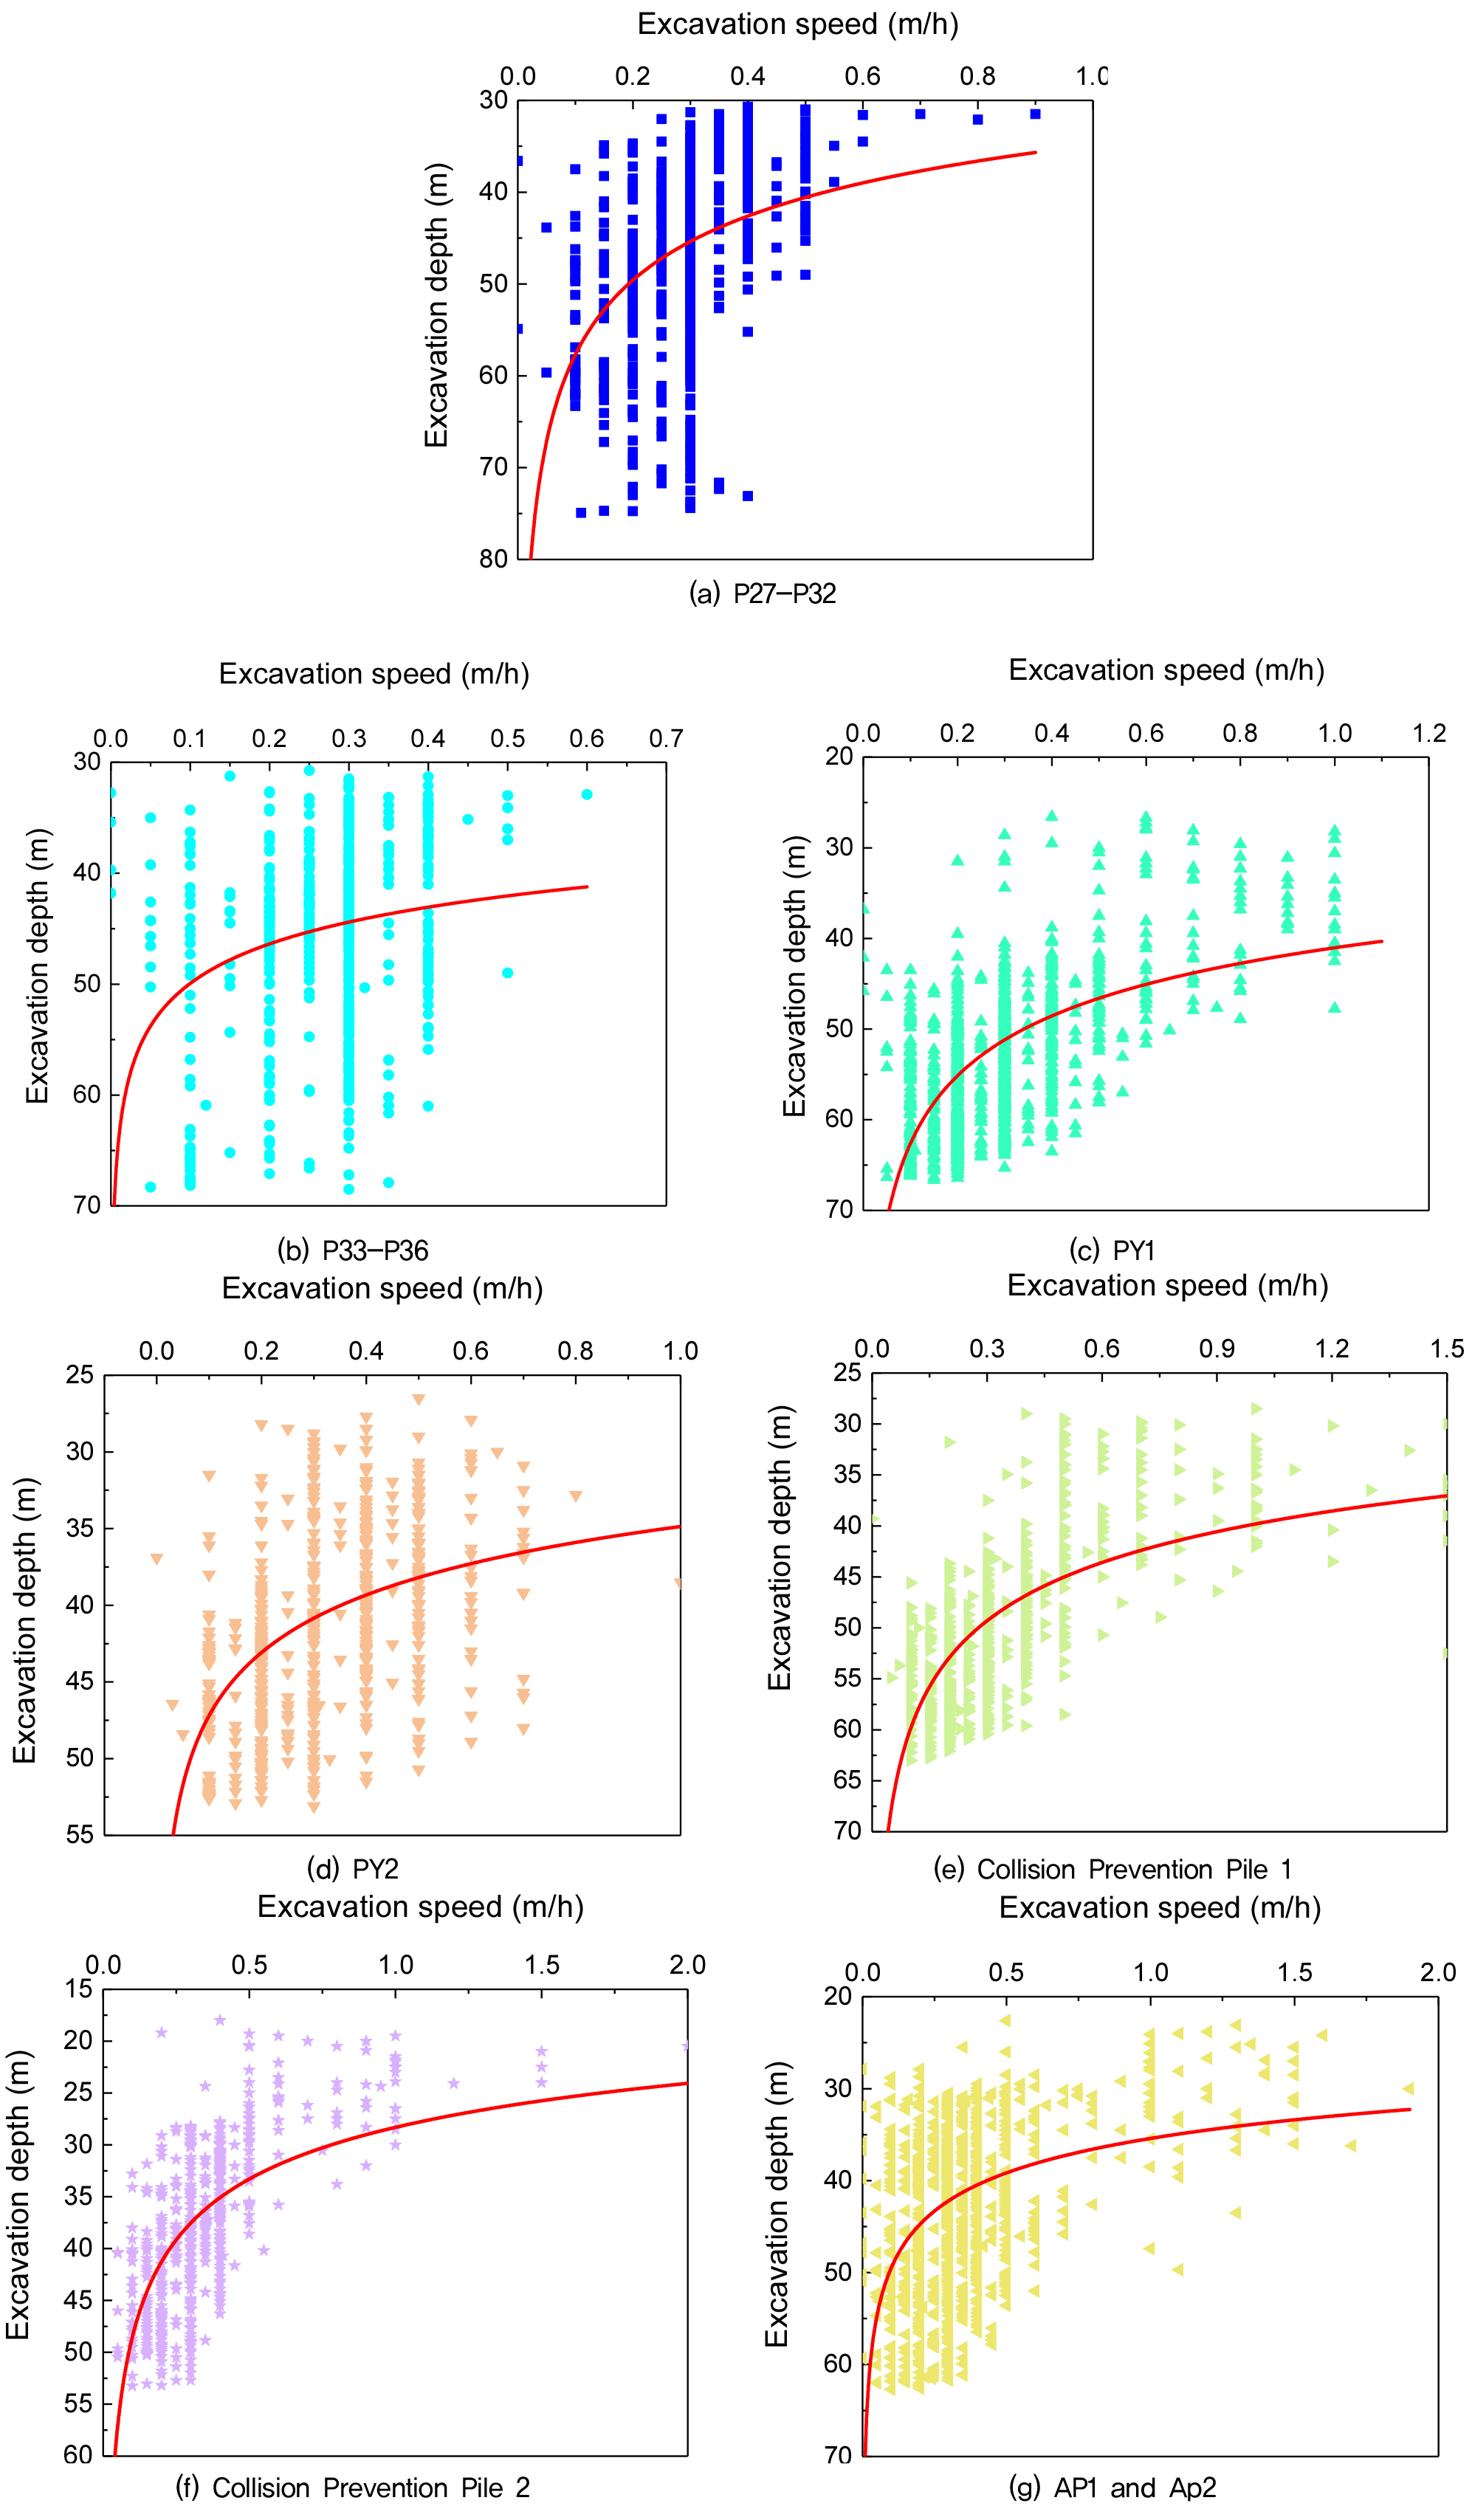
Fig. 5 shows the relationship between uniaxial compressive strength (UCS) and excavation speed for offshore and onshore piles. It can be seen from the figure that the excavation speed decreases as the UCS increases. This confirms that harder and stronger rocks (with higher UCS) are more difficult to excavate, resulting in slower excavation speeds. The red solid curve represents the fitted curve based on the experimental results of the uniaxial compressive strength of the pile. As can be seen from the figure, the curve fits the data quite well, indicating that the chosen model accurately captures the relationship between UCS and excavation speed. The excavation velocity decays exponentially as with increasing UCS. At lower values of UCS, the excavation velocity is higher, while for higher values of UCS, the excavation velocity decreases significantly.
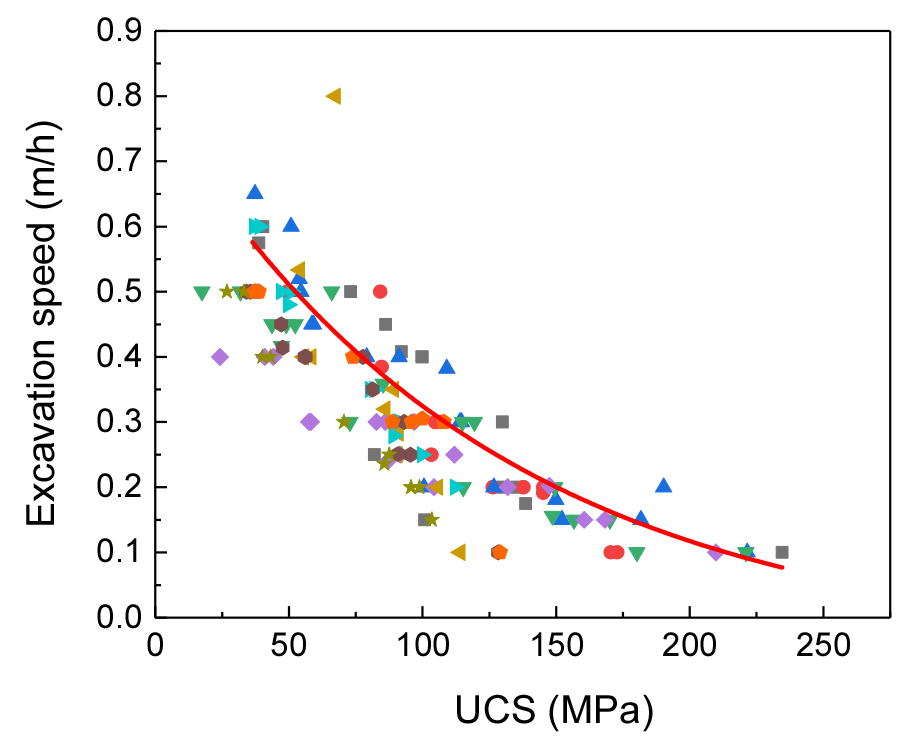
The relationship between UCS and excavation speed is expressed as:
Where,A is the initial amplitude (starting value of excavation speed when UCS is low), t is the characteristic constant related to the rate of decay, indicating how quickly the excavation speed decreases as UCS increases. is the vertical offset, or the excavation speed value as UCS approaches infinity. x represents uniaxial compressive strength (UCS) and represents excavation speed.
For the values of the parameters of the exponential function and the other parameters of the fit are shown in Table 3.
Table 3.
Fitting parameters of the exponential decay model for uniaxial compressive strength and excavation speed
| A | 0.83877±0.1898 |
| t | 123.48105±84.78082 |
| −0.04856±0.25746 | |
| R-Square (COD) | 0.74779 |
| Adjusted R-Square | 0.70575 |
The three parameters A, t and in Table 3 were calculated as part of fitting an exponential decay model to the relationship between uniaxial compressive strength (UCS) and excavation speed. The calculations of these parameters are based on a non-linear regression process, specifically using a least-squares method, which minimizes the difference between observed excavation speeds and the values predicted by the model. Here is a brief explanation of each parameter:
A (Amplitude): This parameter represents the initial amplitude of the excavation speed when the UCS is relatively low. It is determined during the fitting process as the best-fit starting value for the model curve. By adjusting AAA, the model aims to capture the initial level of excavation speed as UCS begins to increase.
t (Decay Constant): The decay constant ttt controls the rate at which excavation speed decreases as UCS increases. A larger value of ttt indicates a steeper decrease in excavation speed with increasing UCS, while a smaller value suggests a more gradual decline. The value of ttt is adjusted during the regression process to achieve the best match between the model curve and the observed data.
(Vertical Offset): This parameter represents the minimum excavation speed that the model predicts when UCS becomes very high. It serves as a vertical offset, ensuring that the predicted excavation speed does not become negative or unrealistically low as UCS increases. The value of y0y_0y0 is adjusted during the fitting process to align the curve with the observed data points, especially at higher UCS values.
These parameters were derived using a non-linear curve-fitting approach, ensuring that the model provides the best possible representation of the observed relationship between UCS and excavation speed. The fitting process aims to optimize these parameters to minimize the residuals between the observed and predicted excavation speeds.
As can be seen from Table 3, the R-Square value of 0.74779 indicates a fairly good fit, meaning that about 75% of the variance in excavation speed can be explained by the UCS using this model.: The Adjusted R-Square value of 0.70575, it also supports the goodness of fit, considering the number of predictors.
In addition, the calculation formula of R-squared is as follows.
Where, represents actual observed values, represents predicted values from the model and represents mean of the observed values.
In summary, this model and fitted curve clearly demonstrate the negative exponential relationship between UCS and excavation speed, with the function providing a strong fit to the data points. The decreasing excavation speed at higher UCS values aligns with real-world expectations of harder materials being more resistant to excavation.
Since uniaxial compressive strength (UCS) directly reflects the bearing capacity of rocks under compressive conditions, point load strength is often used for a quick estimation of UCS, especially when UCS tests cannot be performed. Although the point load strength test has the advantage of rapidly estimating UCS in the field, its lower accuracy makes it unsuitable as a detailed standard for rock classification. Under laboratory conditions, UCS measurements are more accurate and can provide more representative strength data for rocks. Therefore, this study primarily utilizes UCS and RCD excavation speed for analysis, with point load strength serving as a supplementary reference to avoid data redundancy and misleading interpretations. In addition, the empirical relationship between point load strength and uniaxial compressive strength is shown in Eq. 2 (Singh et al., 2012).
Where, K is an empirical coefficient. For harder rocks, K=21-24, for softer rocks, K=14-16. Is represents the point load strength.
3.2 Results Analysis
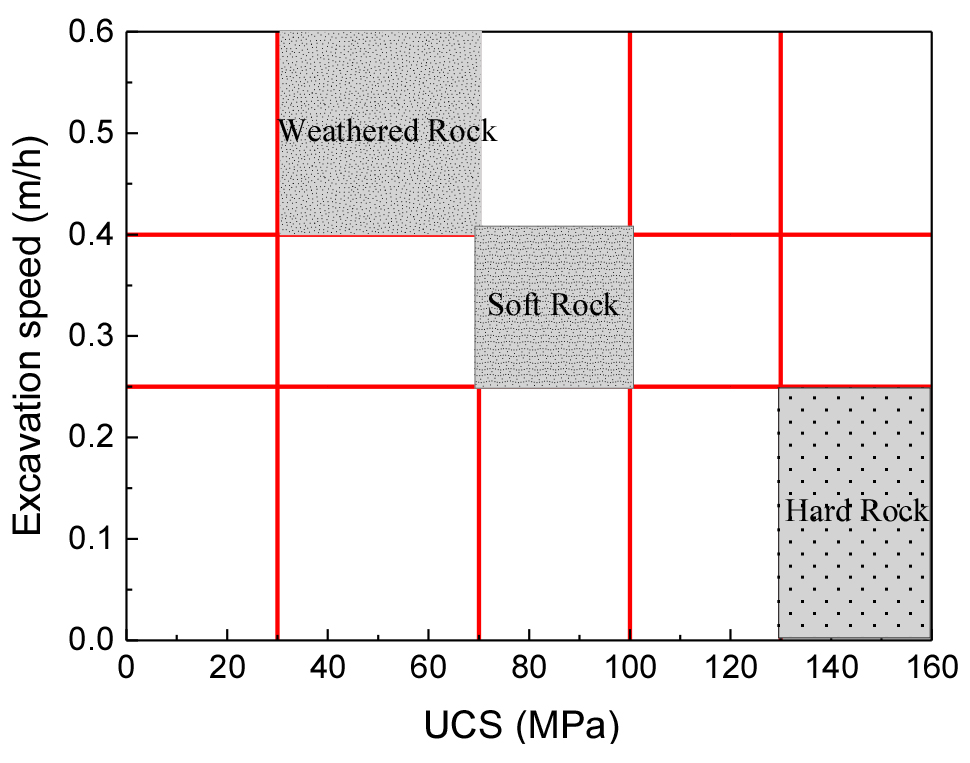
Excavation speed is one of the most widely used parameters in the field, as it directly reflects the difficulty of excavating specific rock layers. A faster excavation speed typically indicates softer, more weathered rock, whereas a slower speed suggests harder, more intact rock layers. Fig. 4 compares excavation speeds at different depths, revealing a gradual decrease in excavation speed as depth increases. This trend is due to the significant increase in rock strength and hardness with depth, which leads to reduced excavation efficiency. This also illustrates the variation in rock types encountered during excavation. In Fig. 6, a boundary is used to preliminarily classify the rock types based on excavation speed. It is evident that the onshore piles involve only two rock types, while the offshore piles (PY1, PY2, Collision Prevention Pile 1, and Collision Prevention Pile 2) involve three types of rock. According to the characteristics of this project, these three rock types are weathered rock, soft rock, and hard rock.
Combined with the relationship between excavation speed and uniaxial compressive strength shown in Fig. 5, the excavation speed tends to decrease exponentially as the uniaxial compressive strength increases. This also verifies the results of Fig. 4 that the deeper the formation and the harder the rock, the greater the uniaxial compressive strength, resulting in the excavation requiring more time and more powerful equipment, which in turn slows down the excavation speed. Additionally, although no separate plot of the relationship between point load strength and excavation speed was provided, since point load strength is usually proportional to uniaxial compressive strength, their trends are generally similar and apply to the results shown in Fig. 5.
Based on the analysis of RCD excavation speed and uniaxial compressive strength, and with reference to the rock classification standards of the Ministry of Land, Infrastructure, and Transport of South Korea, the rocks were classified (Kim and Lee, 2008) (Fig. 6 and Table 4).
Fig. 6 and Table 4 are based on data from excavation speed and uniaxial compressive strength (UCS). This classification standard can be applied to future engineering projects involving similar geological conditions to help optimize construction plans and improve project efficiency.
4. Conclusions
This study, based on the pile construction process for a bridge in South Korea, classifies rocks using RCD excavation speed and uniaxial compressive strength (UCS), along with point load strength, for application in construction projects under complex geological conditions. Through the analysis of measured data, the following conclusions were drawn:
(1)Through the analysis of the rock layers encountered in the Bridge project, a quantitative relationship between rock strength and excavation efficiency was derived. Based on experimental data, an exponential decay model was proposed, which clearly demonstrates that excavation speed shows a significant exponential decline as UCS increases. This model confirms the basic principle that the stronger the rock, the slower the excavation speed, consistent with empirical findings in engineering practice.
(2)By classifying weathered rock, soft rock, and hard rock, this study further divided the excavation characteristics of rocks with different strengths. Combining data on RCD excavation speed and point load strength, specific criteria for rock classification were established. The results show that as rock depth increases, the difficulty of excavation increases significantly, with the distinction between hard and soft rocks being particularly evident in the variation of excavation speed.
(3)The classification system based on excavation speed and UCS helps to assess rock strength in real-time during construction. This system not only improves construction efficiency but also provides economic and safety assurance for projects in complex geological conditions.
Through this study, a rock classification framework suitable for complex geological conditions is proposed. This framework will support future infrastructure projects by improving safety, efficiency, and cost-effectiveness during the construction process.
