

1. Introduction
2. Experimental Setup
2.1 Pull out test box
2.2 Model ground Soil
2.3 Geosynthetics
3. Test Procedure
3.1 Model Ground Preparation
3.2 Pull out load application
3.3 Instrumentation
3.4 Test variables and series
4. Results and Discussion
4.1 General Behavior
4.2 Effect of Saturation on Pull out Capacity
5. Conclusions
1. Introduction
Since the United Nations introduced Sustainable Goals (UN SDSs), the world is striving for sustainable, economical and ecofriendly products and structures. Geotechnical engineering is no exception to this. The use of geosynthetic reinforced soil (GRS) walls in the construction industry is an increasing demand for the past three decades as an alternative to conventional retaining walls. Geosynthetic reinforced soil redistribute the stresses on the soil mass with the help of reinforcing elements to increase the stability of the structures. It is very uneconomical if local material is used for fill. Korea is abundant in weathered granite soil and using it as a backfill is very economical. It is very important to pay heed on the long-term design of these geosynthetic reinforced structures which requires intense knowledge and understanding of the interaction mechanisms between the soil and geosynthetic. For long-term design we need to consider the environmental conditions. Climate change is the major issue these days which is a cause of more frequent and high intensity rainfalls. From the findings of Korean Metrological Administration there has been 11% increase in precipitation and this will keep on increasing because of global warming and sea level rise, predicted up to 17% in the beginning of 22nd century. The rainfalls are the cause of failure of many reinforced retaining wall systems which are made by using the locally available weathered granite soil because the shear strength of this soil significantly decreases and the pull-out capacity of geosynthetic walls is reduced significantly with the increase in saturation. The drainage capability of this soil is very poor and very high pore-water pressures are developed during or after rainfalls that makes the system vulnerable to failure. Hence, it is necessary to cater for the risks and failures associated with these reinforced retaining wall systems with poor drainage capability under heavy rainfalls.
Full scale and laboratory tests with numerical analysis has been carried out by former researchers on the interaction between granular soil and geosynthetics (Goodhue, Edil and Benson, 2001; Moraci and Gioffrè, 2006; Handy, 2007). The studies of Keller, 1995; Almohd, Abu-Farsakh and Khalid, 2006; Abdi and Arjomand, 2011; Shi and Wang, 2013; Joanna et al., 2016) show that the interfacial shear strength is largely increased with the use of geosynthetics. From the studies of Zornberg and Kang (2005) it can be seen that drainage increases the pull-out capacity through the dissipation of pore pressures. Yin et al. (2008); Raisinghani and Viswanadham (2010) also in their research indicated the provision of drainage increases the pull-out capacity of low permeable soils. Till now, the study on the use of cohesive soils specifically weathered granite soil as a back fill in geosynthetic earth walls is insufficient. Thus, the interaction mechanism is not fully understood.
The objective of this paper is to generate experimental data necessary for quantifying and qualifying the effect of change in saturation on the pull-out capacity of geosynthetic reinforced weathered granite soil. This paper discusses the effect of saturation on the pull-out capacity of geosynthetic reinforced soil. Porewater pressure, earth pressure, temperature and volumetric water content was also monitored using sensors and TDS data logger. The soil was locally available weathered granite soil. The tests included variations in saturation of about 90%, 80%, 70% and 45% (optimum moisture content). The tests were performed according to ASTM standard D 6706-01.
2. Experimental Setup
This section provides the details of the experiment setup, materials, instrumentation and test procedure.
2.1 Pull out test box
The Pull-out machine used, consisted of an open rigid box divided in to 3 parts. Middle part had an open section for geosynthetic to be placed and hold by a clamp. The upper box had an inflated air bag to apply the pressure. The box was 60 cm long, 40 cm wide and 50 cm deep. From the knowledge of previous studies like Sugimoto, Alagiyawanna and Kadoguchi, 2001; Palmeira, 2004 PVC sleeves were used to reduce friction near wall due to load effect. The machine had the ability to control the displacement rate as well as loading rate and maximum load of the system.
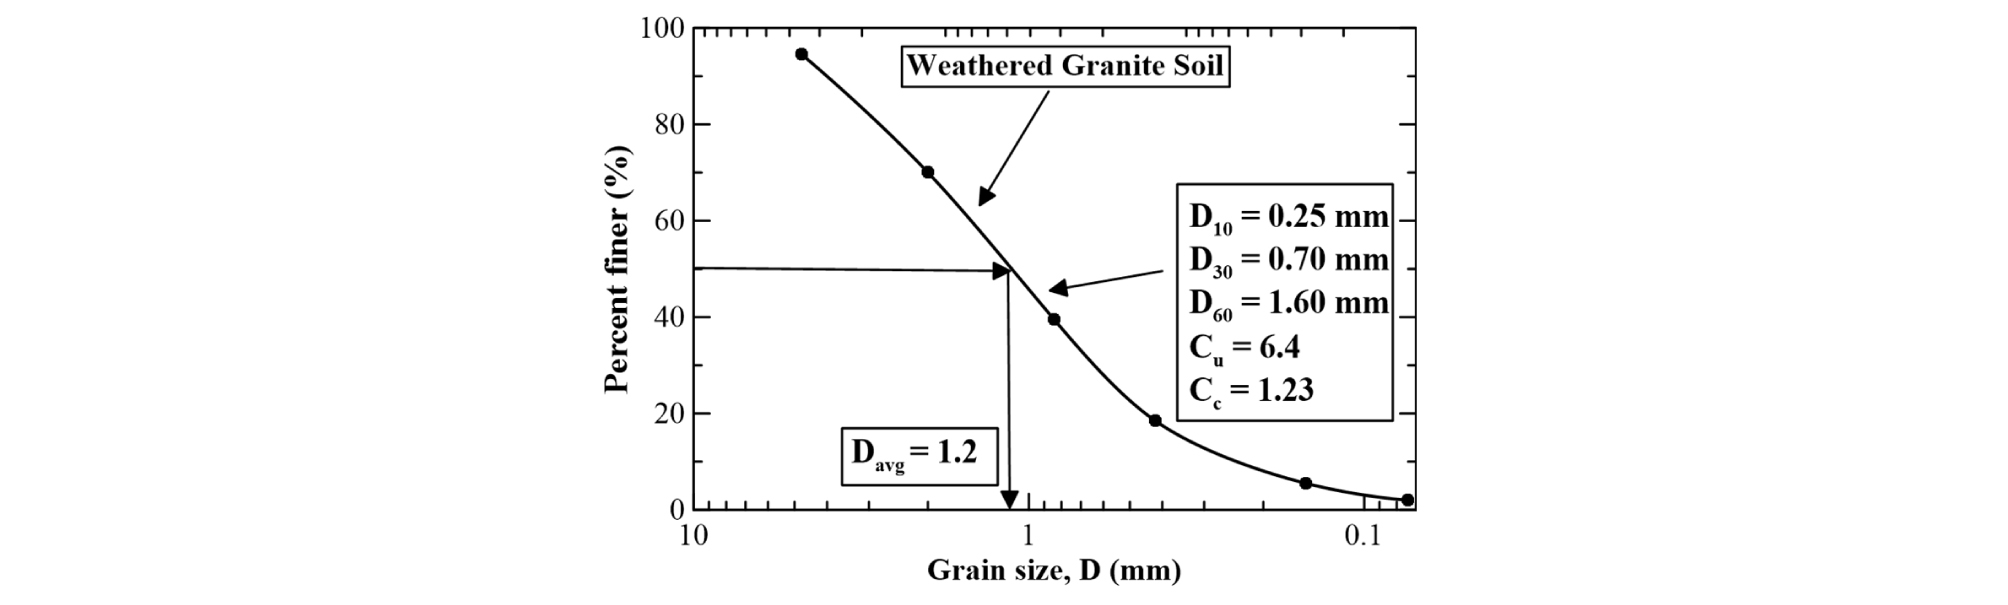
2.2 Model ground Soil
Weathered granite soil was used to prepare the model ground. According to USCS (ASTM 2487-90-1992) the soil was classified as SM. By using a hand compactor, the soil was compacted in 6 layers to achieve about 80% of its unit weight of 17.36 kN/m3, determined by the Standard Proctor test according to ASTM D698-12e2.
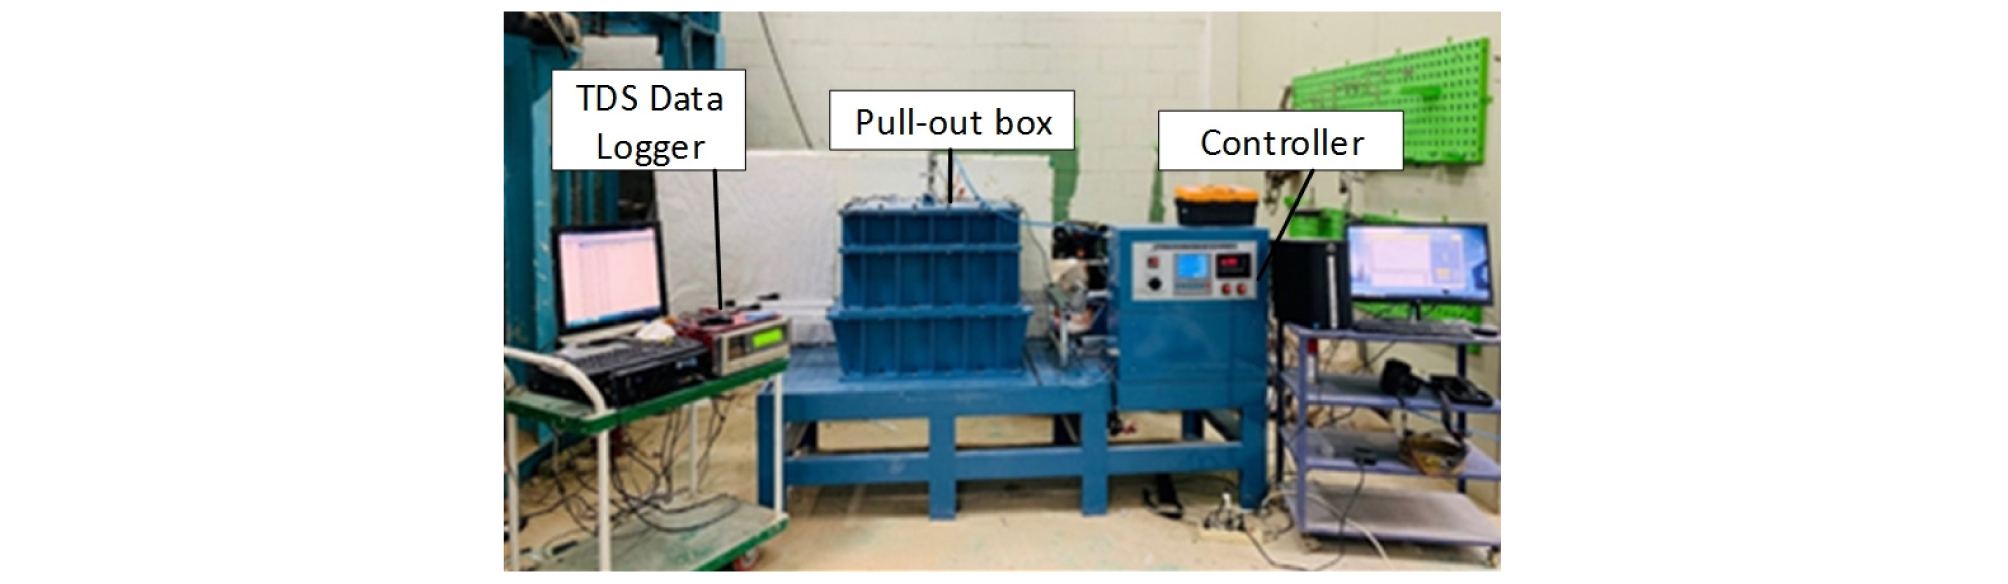

Table 1. Geotechnical Properties of Soil

2.3 Geosynthetics
In this experiment a biaxial geogrid made up of polyethylene was used. The length of geogrid was kept as 70 cm and its width was 30 cm in all tests with an aperture size of 5 cm x 5 cm. The geogrid was attached to the clamp of the pull-out machine with the help of tighteners, nuts and bolts.


3. Test Procedure
In order to get repetitive results, the test method and techniques were standardized and performed accordingly. This section discusses the test mechanism and step by step methodology of the experiment.
3.1 Model Ground Preparation
The model ground for pull out test was prepared using decomposed granite soil with initial water content of soil of about 15.0% which was the optimum moisture content. Hand compaction technique used in this study provided the model ground density of approximately 80% with a dry unit weight of 13.88 kN/m3. All other parameters are summarized in Table 2.
Table 2. Standard test settings of the pull-out experiment
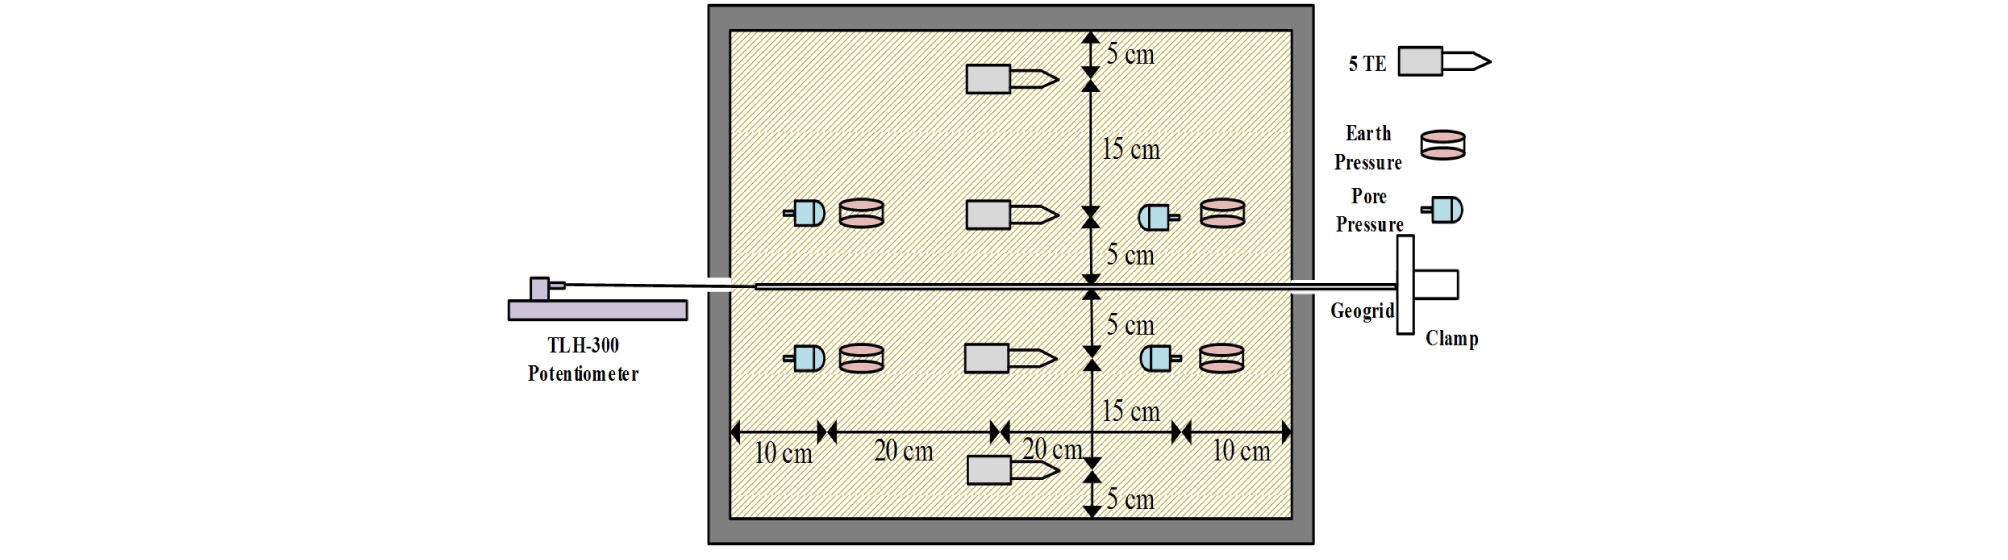
The model ground was created in 6 soil layers with 5 cm height of 1st, 3rd, 4th and 6th layers and soil weight of 17 kg whereas 2nd and 5th layers were 15 cm each with 50 kg soil with proper compaction by hand. The geogrid was placed between 3rd and 4th layers. Fig. 7 shows the details of the model ground preparation.
3.2 Pull out load application
The load application system built with a rubber air bag ensured uniform distribution of pressure. The pressure was created by using a pump connected to the controller of pull out machine which had the capacity of changing the load intensity. It had both analogue and digital systems for accuracy. The load cell capacity was up to about 1000 kN.
3.3 Instrumentation
Each experiment was equipped with a number of instruments in order to monitor the test and obtain data that could be easily cross checked. 3 TLH-0300, potentiometric transducers were used to monitor the displacement of the geogrid attached at near both ends and middle of the geogrid in a diagonal manner. For pore water pressure and Earth pressure measurements, pore water pressure and earth pressure sensors were used in 2nd and 4th layers at 10 cm from the ends. 4 5TE sensors were installed after laying 1st, 2nd, 4th and 5th layers. After the setup was complete normal pressure of 20 kPa, 60 kPa and 100 kPa were applied for different experiments. The horizontal displacement rate was set to be 1.0 mm/min as per ASTM standard D:5321. The clamp also had a linear variable differential transducer (LVDT) to measure the displacement of the geogrid. The whole data was recorded using a Tabular data logger TDS-303. The load application was stopped when the displacement reached around 60 mm or when failure occurred.
3.4 Test variables and series
There are many factors that affect the pull-out capacity of geosynthetics such as physical condition of the soil and the overburden pressure etc. For each degree of saturation, 3 tests were performed with normal loads of 20 kPa, 60 kPa and 100 kPa.
4. Results and Discussion
This study is focused on the behavior of pull-out capacity of geogrid placed in weathered granite soil. The results of the test cases are arranged so that a correlation between the influencing factors and geosynthetic behavior can be developed. Upcoming paragraphs contains the details of the results.
4.1 General Behavior
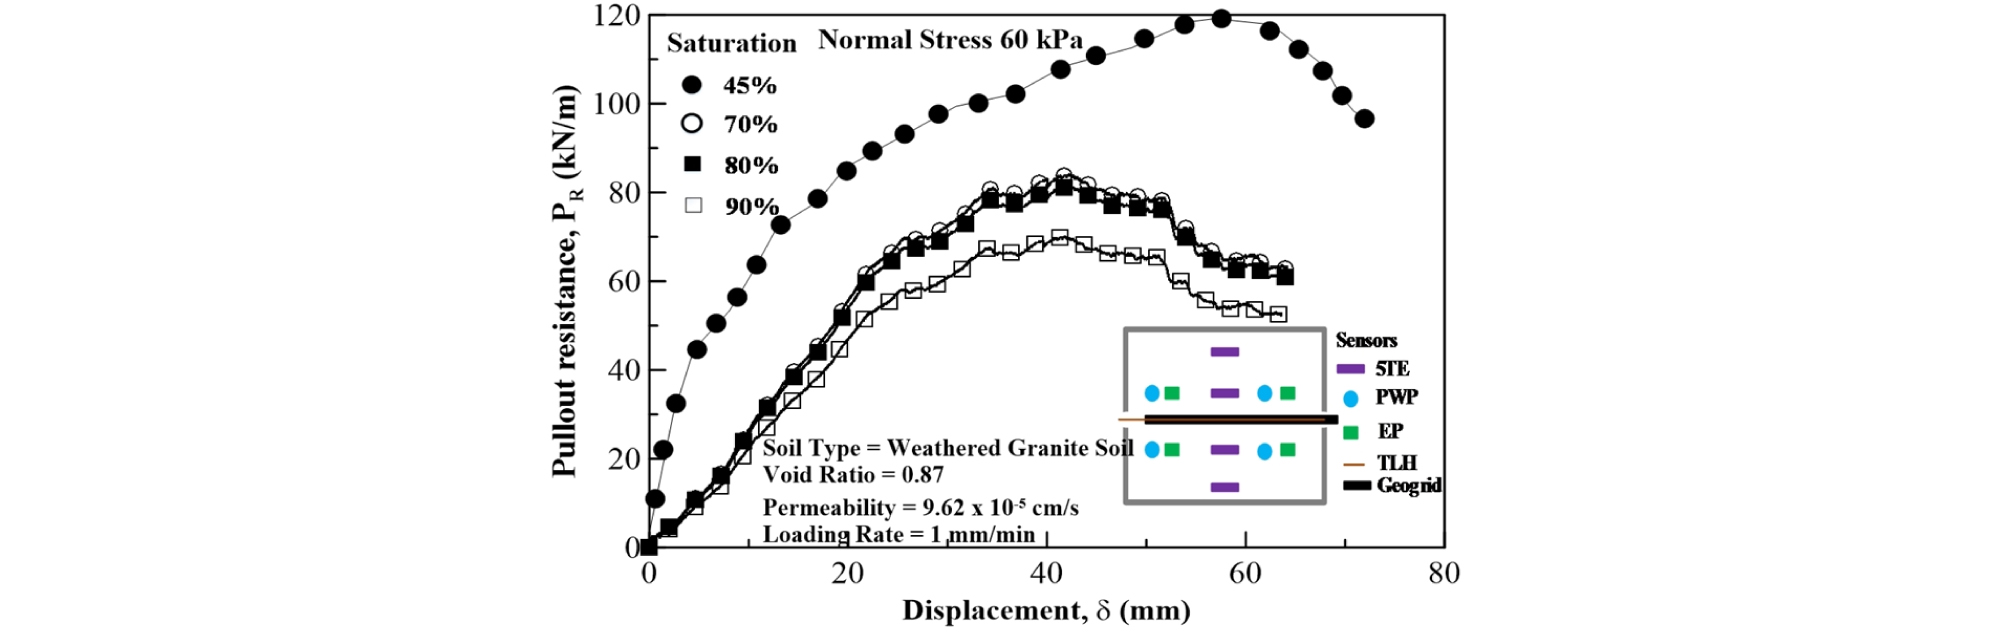
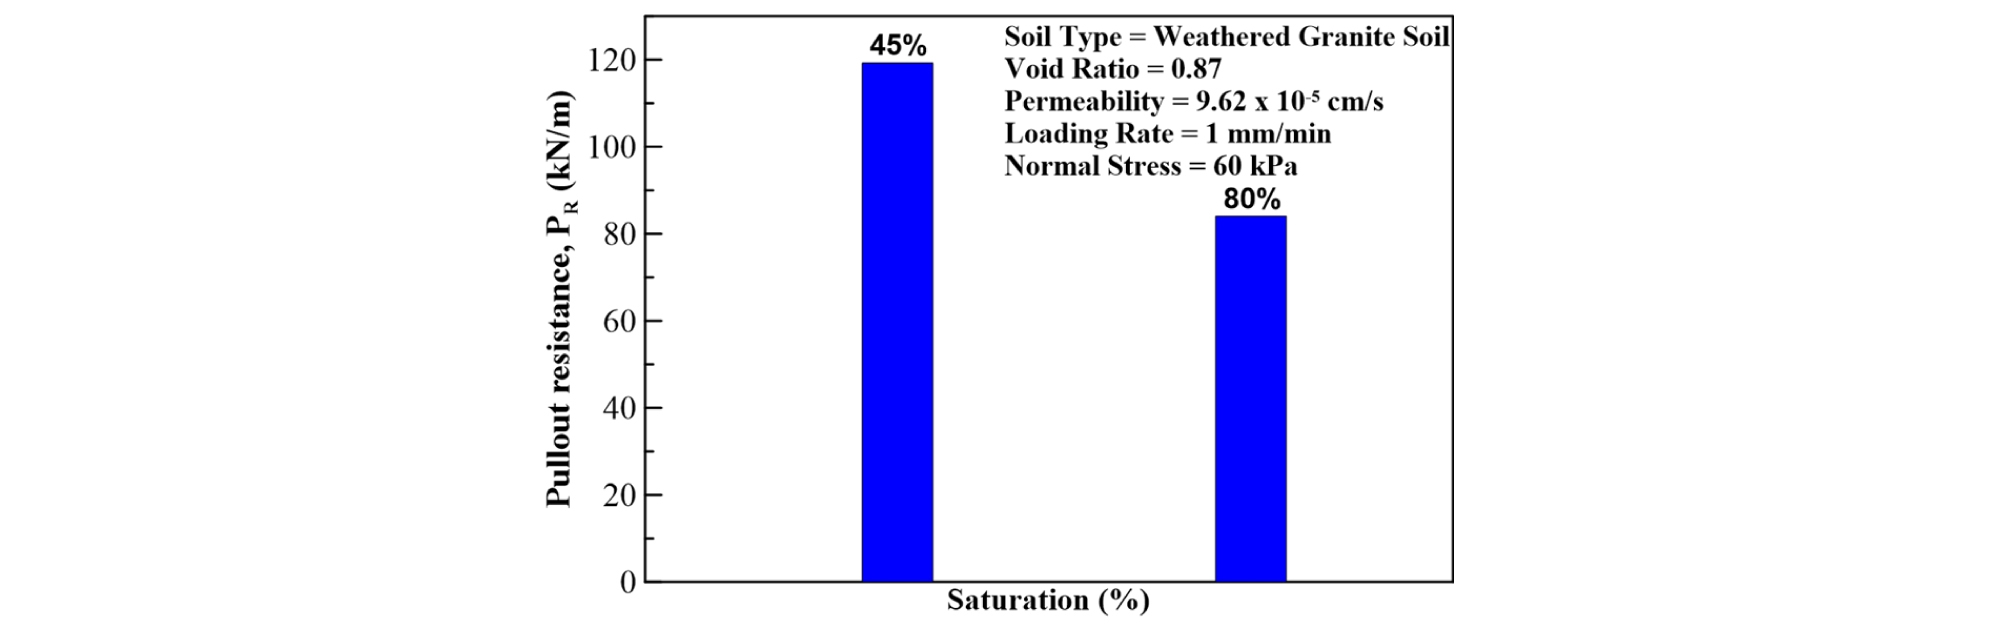
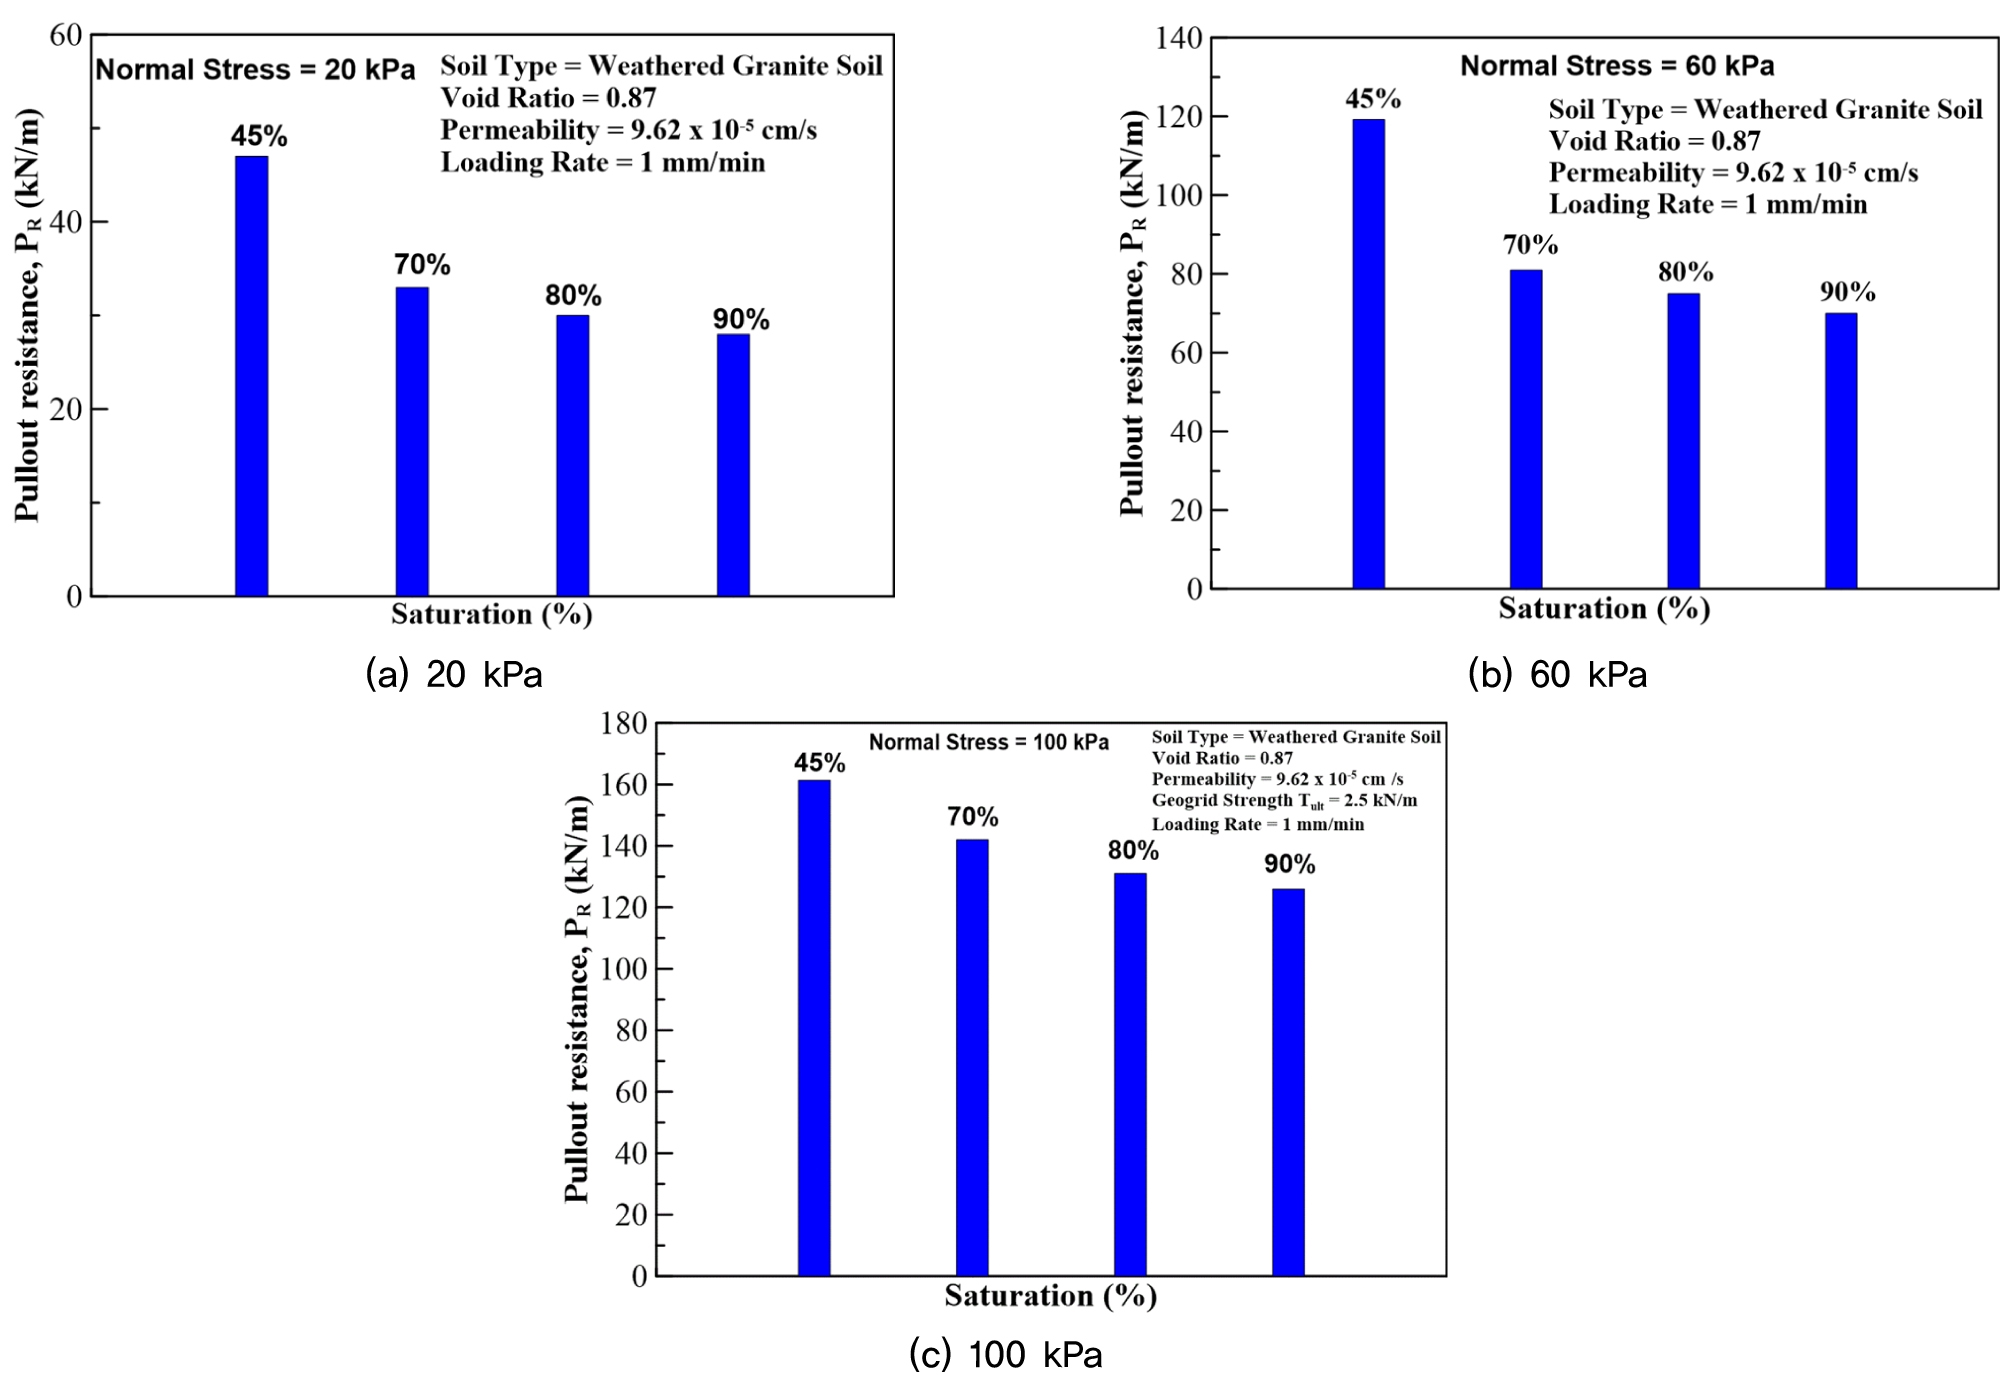
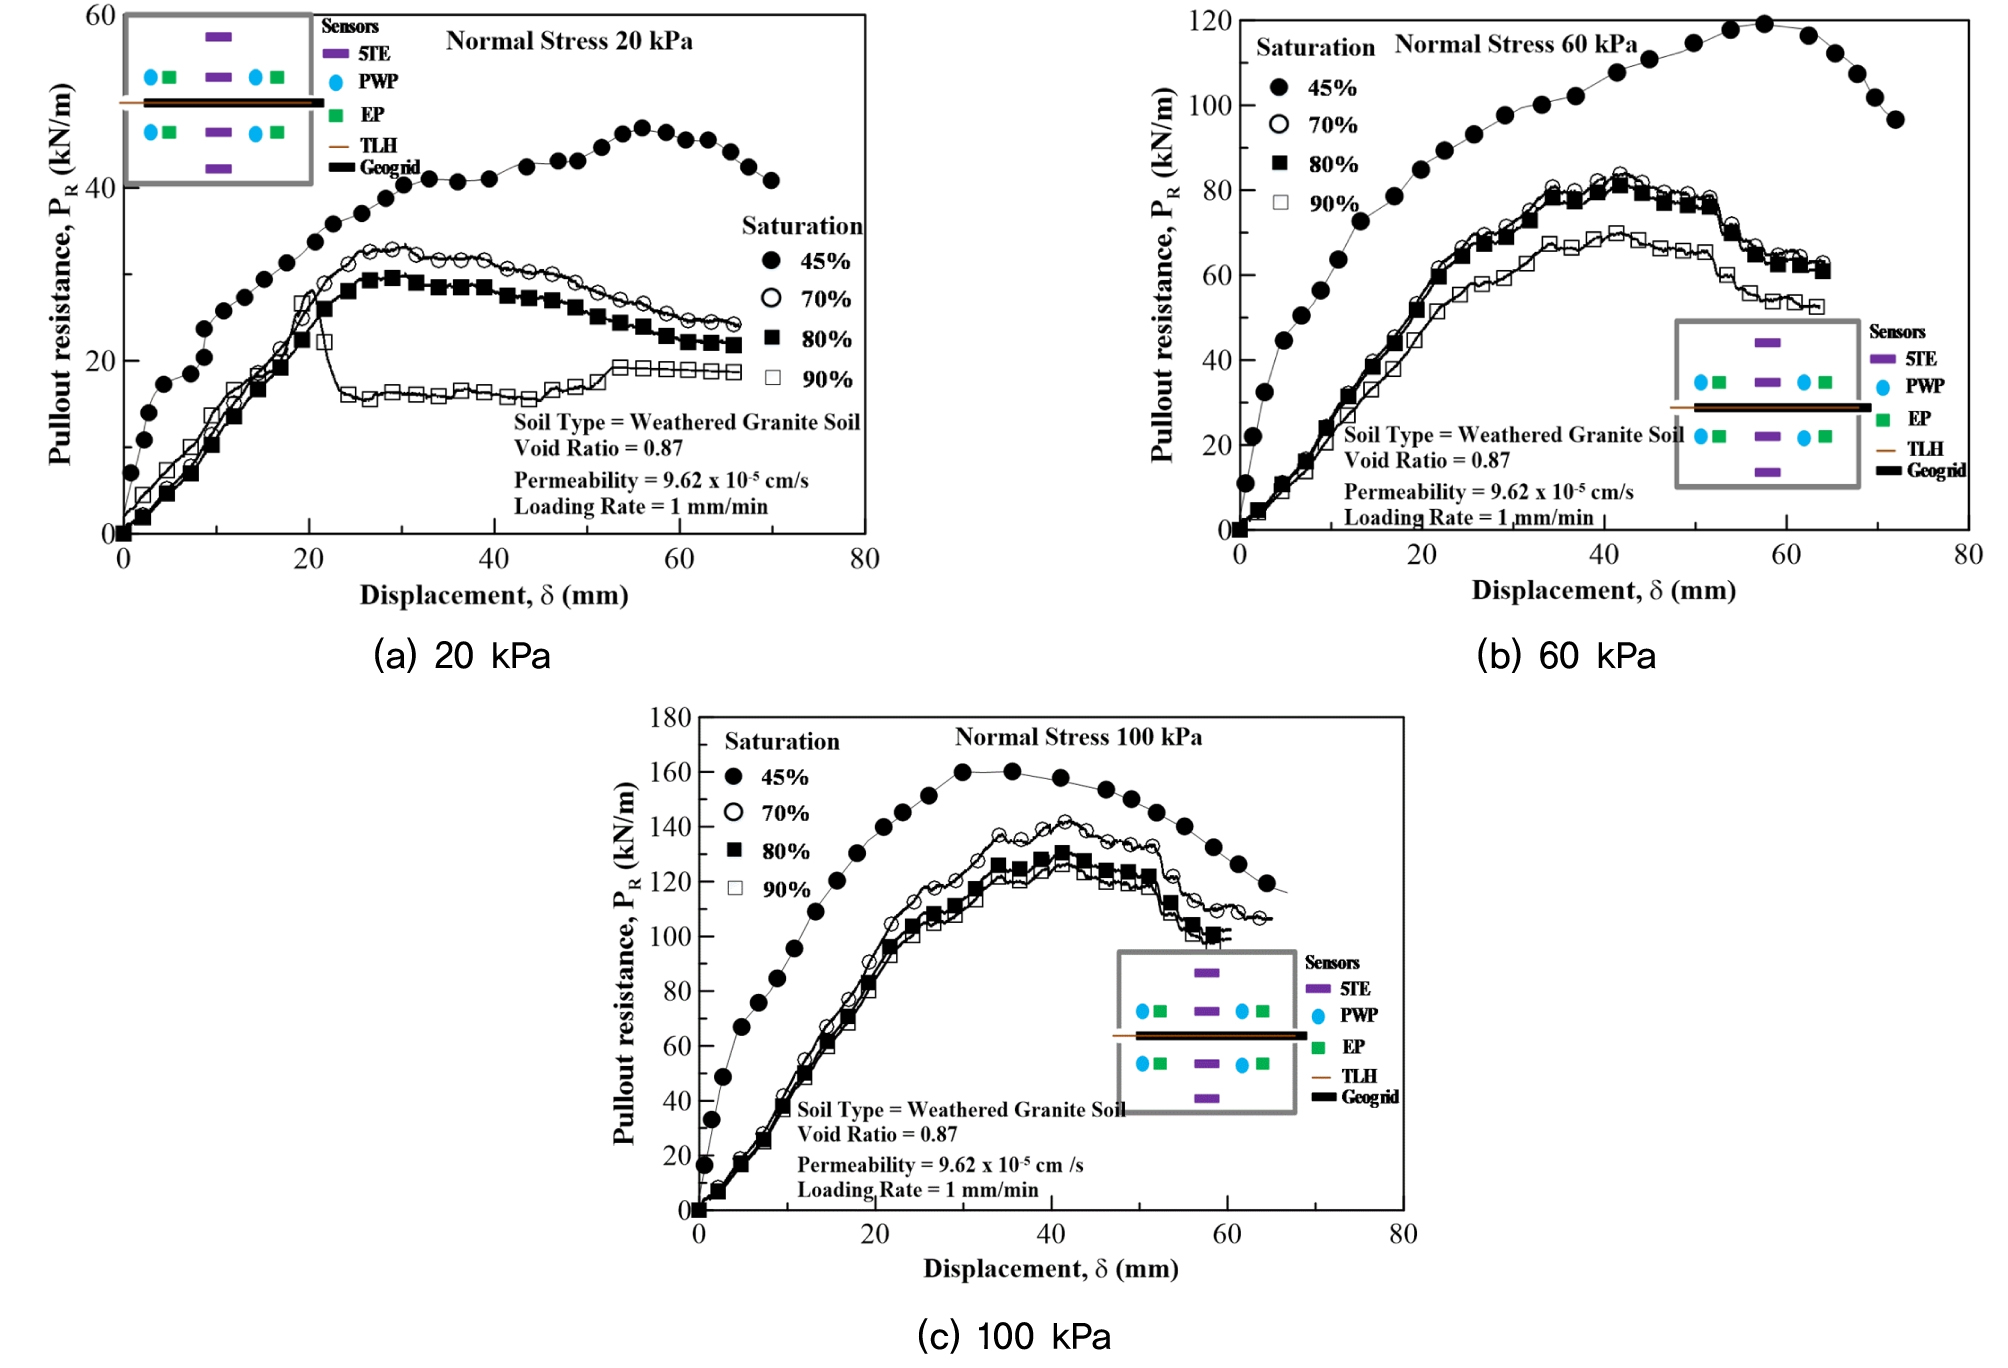
The baseline case of 45% saturation (WC = 15%, OMC) and 60 kPa is presented in this section. For comparison a highly saturated test of 80% is also indicated in the graphs. Figs. 8 and 9 show the response of pullout capacity with the increase in saturation. Fig. 8 represents the general trend of displacement versus pull out strength of geogrid. It is observed that pull out capacity is more for 45% saturation as compared with 80% saturation. The pull-out capacity increases up to its maximum value and then decreases. The same trend can be observed for all the experiments performed. Fig. 9 shows general behavior about the effect of increased saturation on pull out capacity. Decrease in pull out capacity can be noticed from Figs. 10(a), 10(b) and 10(c) which represent variation of saturation at different stresses. The pull-out capacity is decreasing as the saturation increases from 45% to 90%.
4.2 Effect of Saturation on Pull out Capacity
The section shows comparison of pull out capacity with increasing saturation at different normal stresses applied during the experiment. The data like earth pressure, water content and pore water pressure are also presented in the following graphs as a comparison with increasing saturation.
Figs. 11(a), 11(b) and 11(c) contain the plots of 3 normal stresses and 4 saturation conditions versus displacement. Every graph depicts that the maximum pull-out capacity is obtained when the saturation is 45% (OMC). The reason is due the higher interaction of particles and increased particle friction at OMC as compared to increased saturation. The graphs are linear in the beginning and then become non-linear curved shape after a certain value.
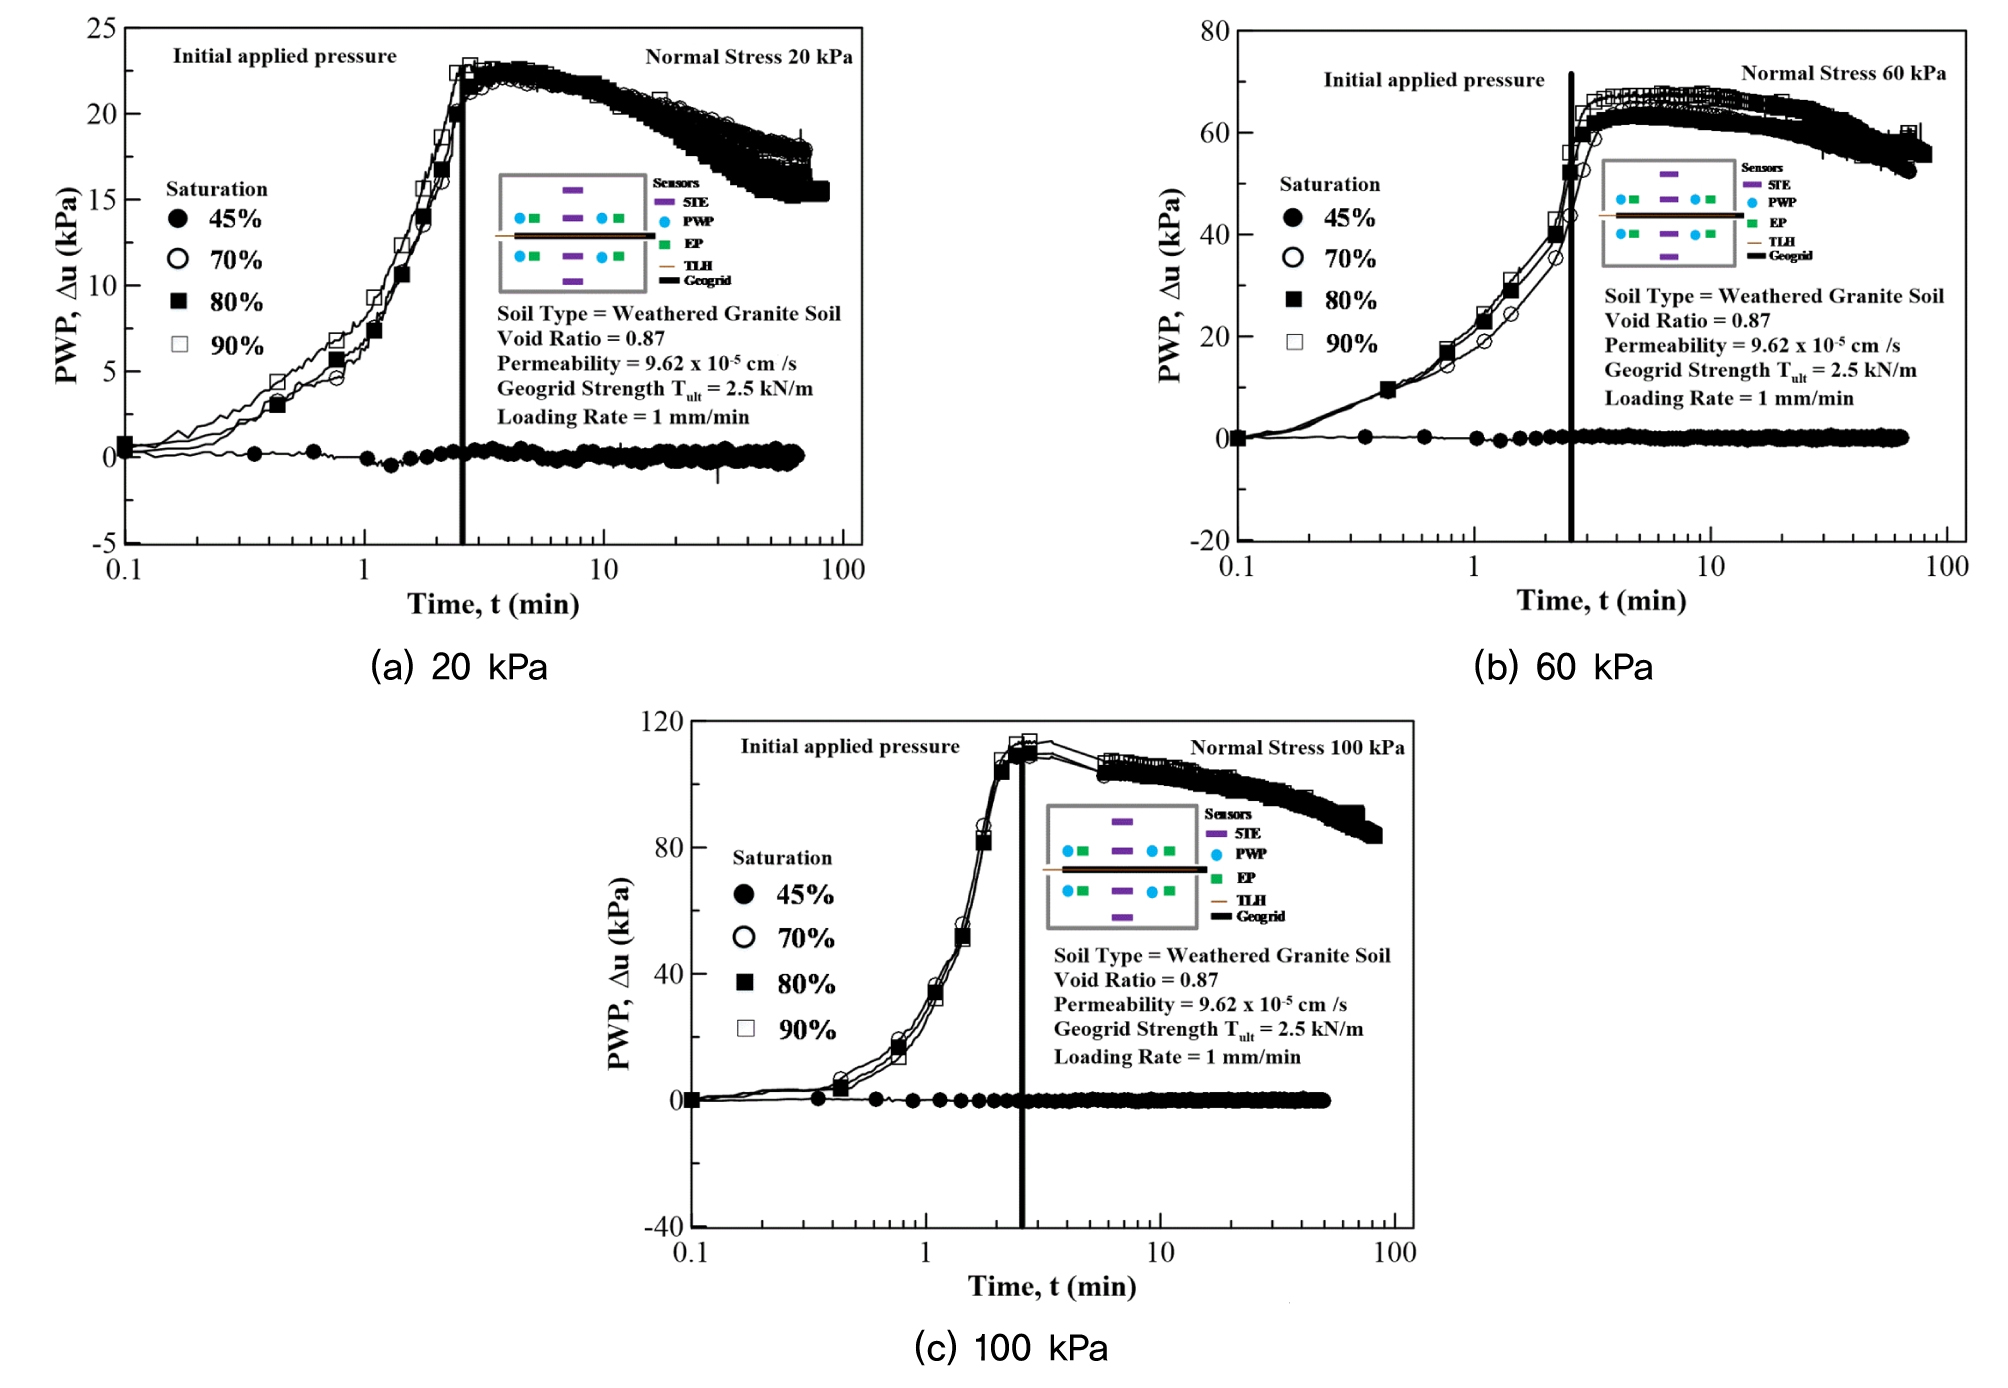
Figs. 12(a), 12(b) and 12(c) are plotted between Pore water pressure with time log. The black thick vertical line represents the time at which external normal load was fully developed and pull out was started, which was about 2.5 minutes. The PWP is maximum for 90% saturation and minimum for 45% saturation of the soil. At OMC the graph is almost a linear line meaning by there is no change in PWP but for other cases, it first develops up to about the same magnitude as the applied load and then slowly decreases. The little decrease is due to small amount of loss of water from the machine.
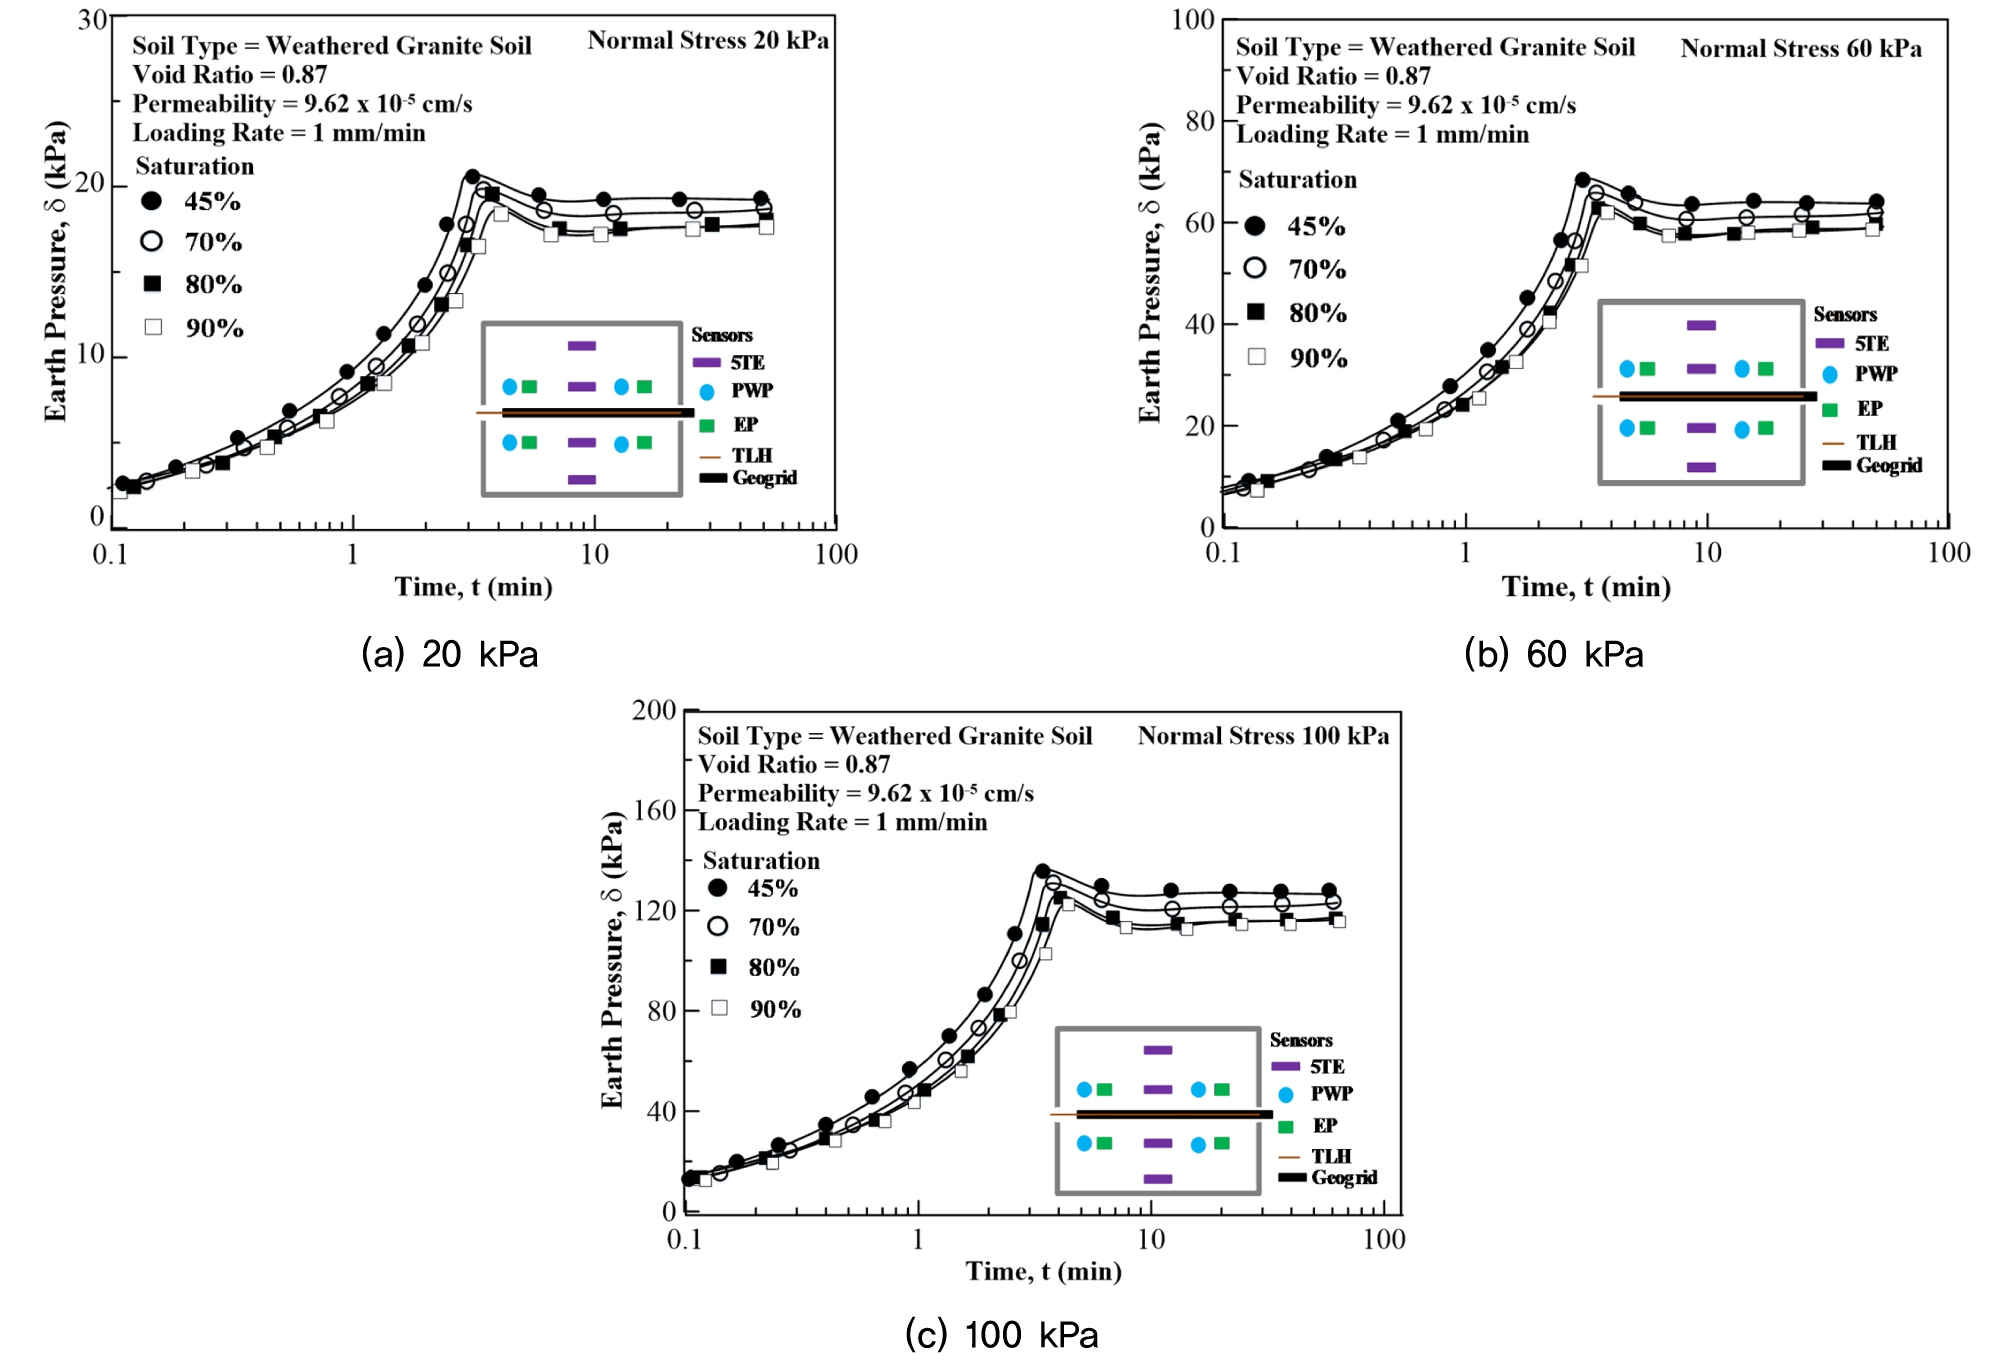
The earth pressure sensors data show that the soil pressure increases as load is increased until it is made constant at around 2.5 minutes, where the pull-out action is started. The earth pressure for 45% degree of saturation is the most and it is decreasing with the increasing saturation. The trend is same for all the 3 normal stresses. Fig. 13(a), 13(b) and 13(c) are the graphical evidence of this statement.
Using the obtained data, analysis graphs were drawn in order to understand the behavior of pullout capacity versus saturation. The results show that as the saturation increases the pull-out capacity decreases and so does the interface friction angle and interaction coefficient.
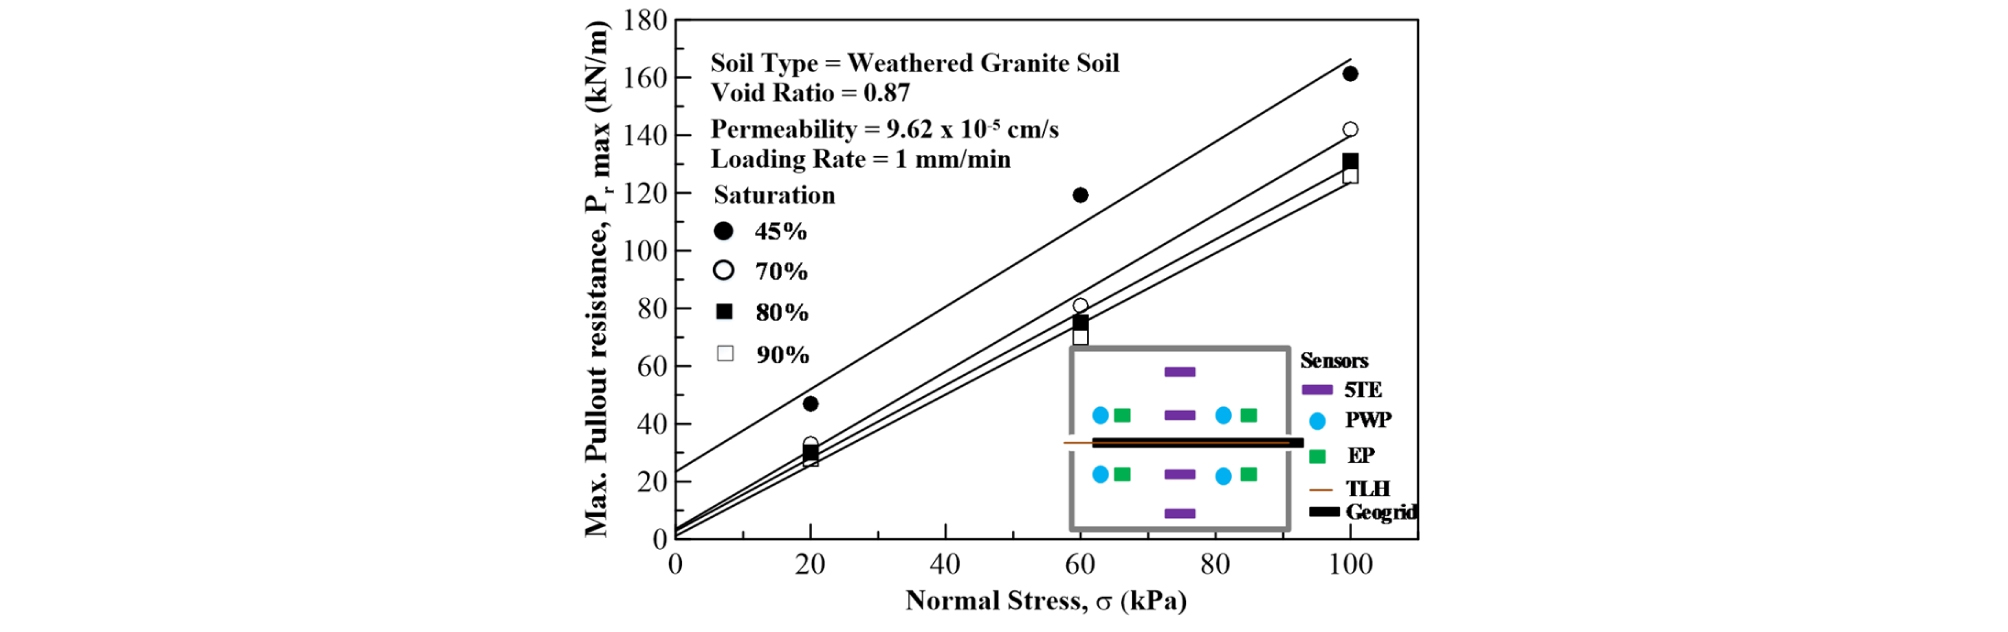
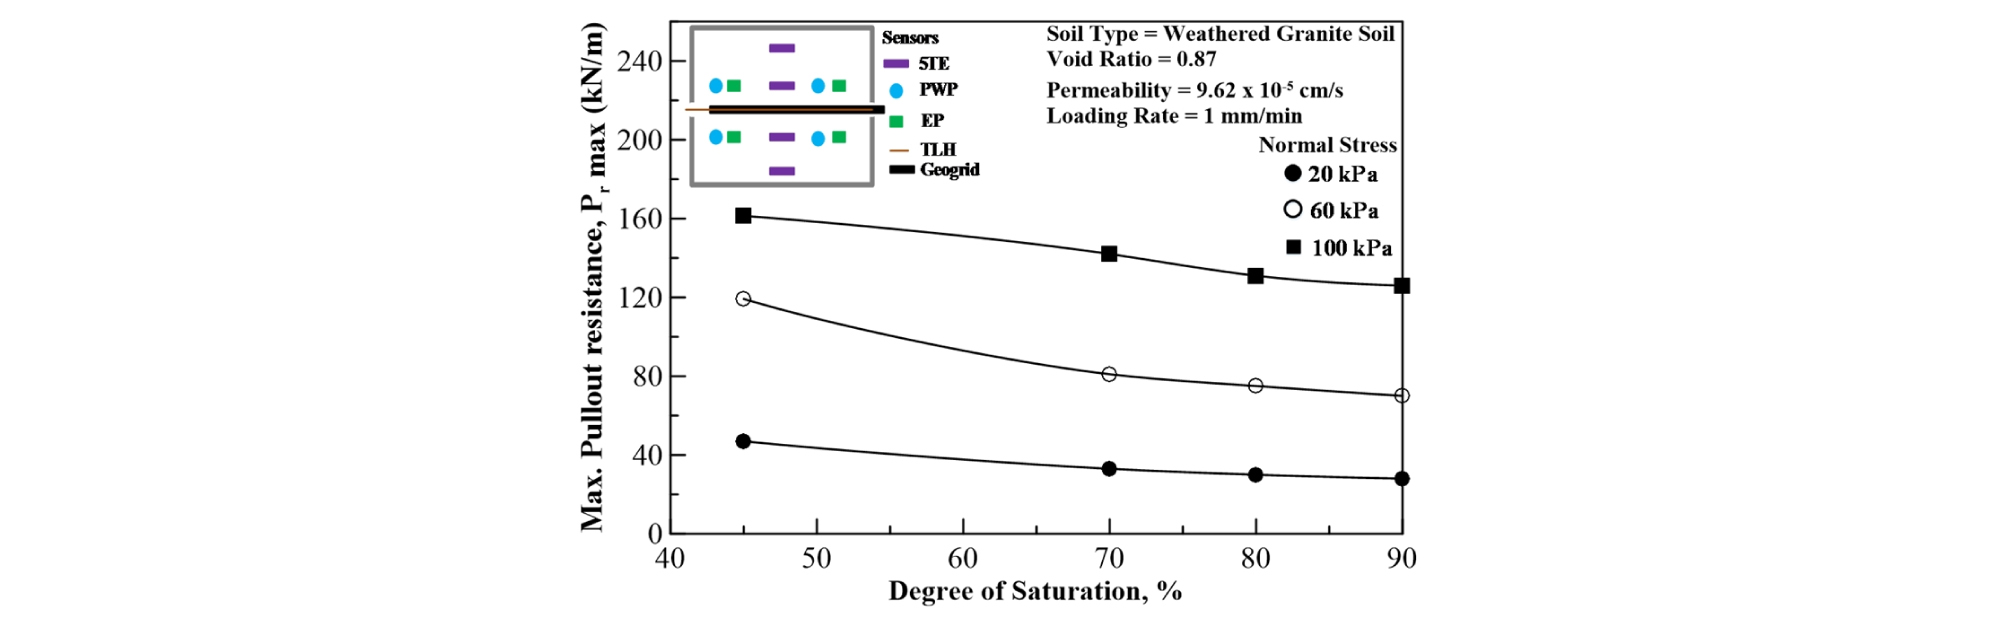
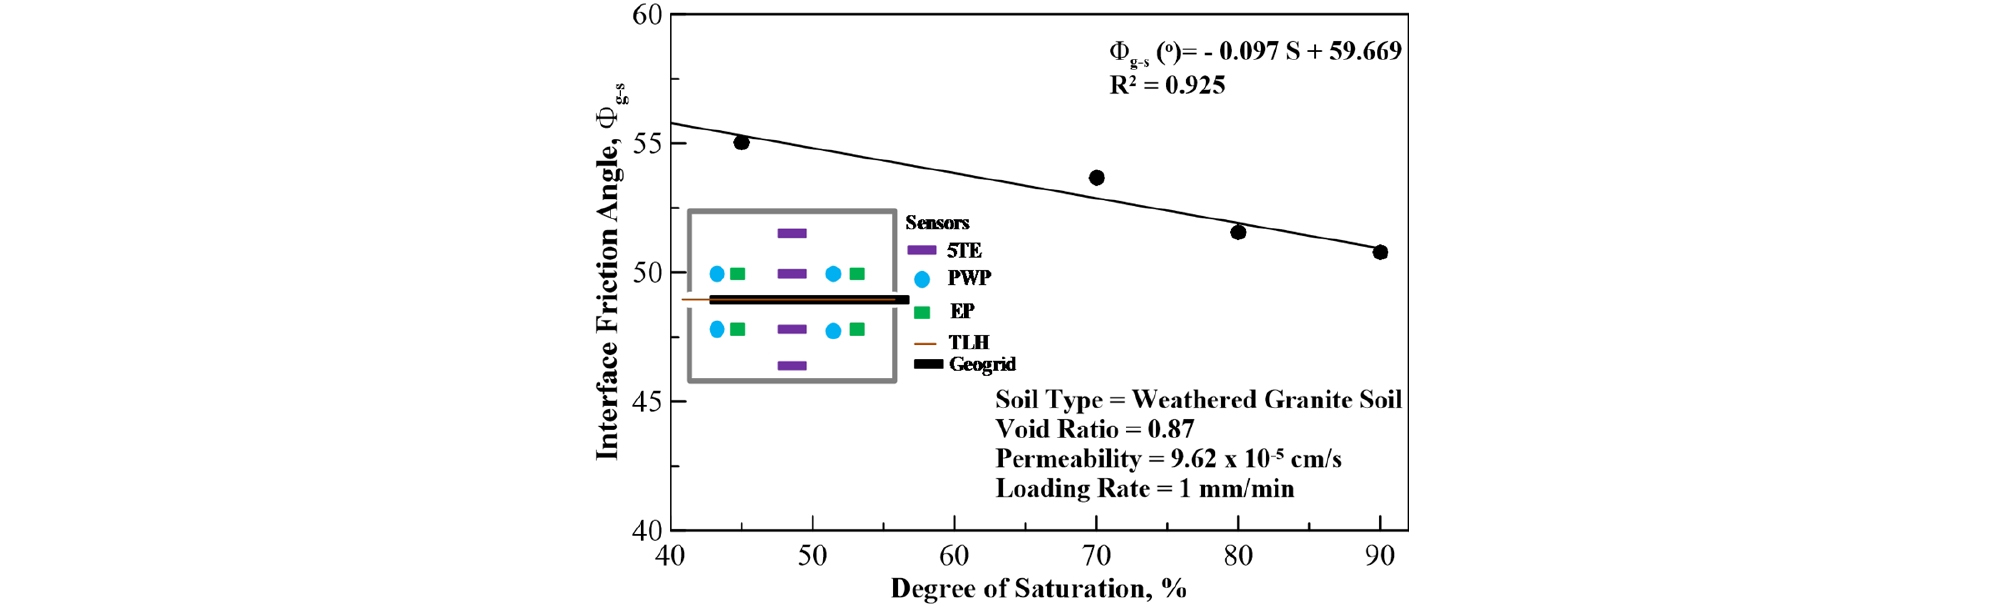
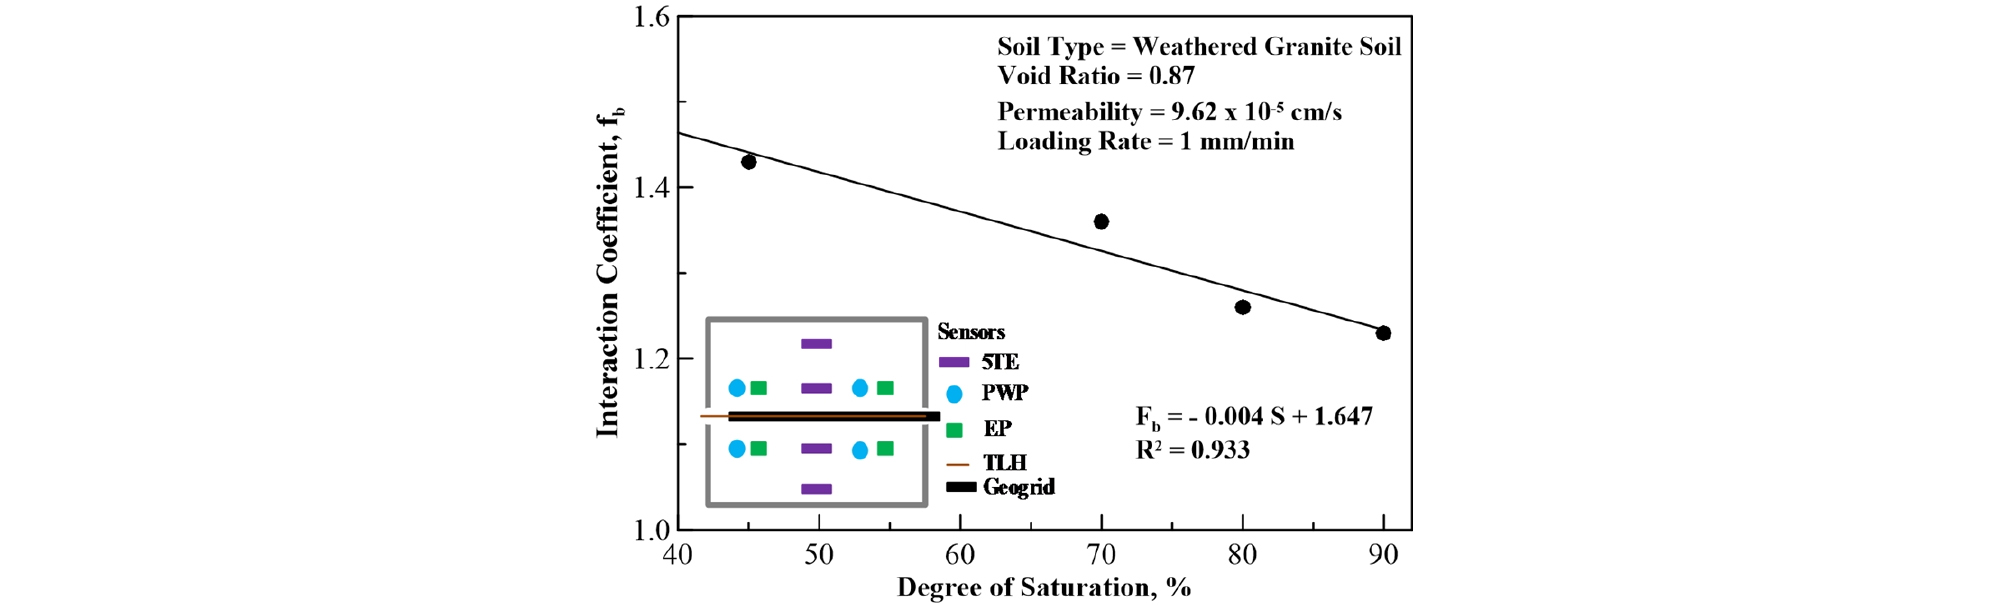
From Fig. 14 it can be seen that the normal stress and saturation plays a very important role in defining the maximum pull-out capacity of the geosynthetic. The more there is external loading the more is the pull-out resistance because the soil particles are squeezed and interlocked thereby increasing the friction and strength of soil. Fig. 15 is the representation of the effect of increased saturation on pullout capacity at different normal loads. As the saturation is increased the pull-out strength is decreased. This is due to the fact that with increased moisture content the interparticle friction of soil mass and the geogrid is decreased. Fig. 16 is plotted between interface friction angle and soil degree of saturation. It shows that as the saturation is increasing the interface friction angle is decreasing because of loss of grip between soil and geogrid. This can be understood by the fact that with more moisture content the density of soil is low and the particles slips easily because of less contact. As the degree of saturation is increased the interaction coefficient of geosynthetic and soil is decreased due to lesser interparticle friction. Fig. 17 Shows the trend of decreeing Interaction coefficient with increasing saturation.
5. Conclusions
This paper presents the outcomes of a series of laboratory experiments about the effect of saturation on the pull-out capacity of geosynthetics. A series of tests were conducted to ensure repeatability and understand the phenomenon of effect of saturation on pull-out capacity of geosynthetics. The tests included a range of variables and were heavily instrumented to monitor the activities happening during the whole experiment procedure. The horizontal displacement versus pull out capacity curves obtained were in agreement with the past literature. It shows the classical behavior of load displacement relationship where the displacement and load are linear up to a certain point then it becomes non-linear. Based on outcomes of the experiment following points can be concluded.
∙ As evident from previous papers, the results of this experiment also show that the pull-out capacity is decreased as the normal load (vertical pressure) is decreased and the trend is linear.
∙ From the results we can deduce that the increase in saturation of soil for a short time due to rain or long time due to ground water level increase will render the reinforced soil slopes to failure as the decrease in pull-out capacity was noted to be around 12.50 % to 33.33 % with the increase in water content. This decrease in strength is due to the less interaction of soil particles with the geogrid as moisture decreases the friction between two surfaces.
∙ For highly saturated soil, the interface friction angle is small because of the contact of soil particles weakens as the water content is increased.
∙ So, a technique is required to overcome these situations. One of the solutions, in the authors opinion, is to provide the geosynthetics with a capability where it can increase the temperature of the ground and drain the excess water so that the reinforced soil slope remains intact. This theory is being analyzed by the same authors and preliminary experiments have already been performed.
