

1.Introduction
2. Particle Image Velocimetry (PIV)
3. Laboratory Deep Excavation Modeling
3.1 Test setup
3.1.1 Test box configurations
3.1.2 Saturation process
3.1.3 Wall construction
3.1.4 Strut preparation
3.2 Monitoring of deep excavation performance
3.3 Procedure to use the PIV
3.4 Material used
3.4.1 Model ground
3.4.2 Concrete wall
3.5 Test Procedure
3.5.1 Model ground preparation
3.5.2 Excavation procedure
3.6 Parametric study
4. Results and Discussion
4.1 Effect of wall stiffness
4.2 Effect of ground water table
4.3 Effect of relative density
4.4 Results analysis
5. Conclusions
1. Introduction
These days many deep excavation projects carried on for the construction of high rise buildings and subway due to rapid urban developments. Changes in the state of stress in the ground mass around the excavation and subsequent ground losses inevitably occur During deep excavation. These changes and ground losses affect the surrounding ground in the form of ground movements, which eventually impose direct strains onto nearby structures. The prediction of ground movements and valuation of the damage risk have become a fundamental part of the planning, design, and construction of deep excavations in built up environments. To analyze the impact of ground deformation zone during the successive ground excavation, one of ground deformation prediction technique particle image velocimetry (PIV) is used in present study. The excavation work in urban area as an impact of ground movement due to deep excavation has been acknowledged by numerous researchers (Magnus et al. 2004; Tan and Wei 2012; Halim and Wong 2012; Namazi and Mohammad 2013; Li et al. 2014).
GeoPIV is the MATLAB module to measure the soil deformation in geotechnical models using particle image velocimetry (PIV) technique developed by White et al. (2001a). It is known as particle image velocimetry (PIV) as the technique is being used to measure the velocity of seed particles, basically it is developed by Adrian (1991) for the particle movements in fluid mechanics. It had become routine experimental practice in many geotechnical research laboratories around in 21st century and it had been studied by many researchers (e.g., White et al. 2001a, 2001b, 2003; Take 2015; Rechnmacher and Finno 2004).
In the design of retaining structure, the prediction method for ground settlement and wall displacement had been studied by many researchers. Clough and O’Rourke (1990) prolong the work by Peck (1960) and obtained empirical settlement envelopes. Ou et al. (1993) accumulated and analyzed field data concerning wall movement related with deep excavation and defined the apparent influence range (AIR) for damage assessment of nearby structures. Cording (1985) provided a volume based relationship for the distribution of ground displacement behind the excavation wall. Yoo (1996) collected field data on lateral wall movement for walls constructed in soils overlying rock from more than 60 different excavation sites and analyzed the data with respect to wall and support types.
There are many studies presented by many researchers on the prediction of ground movement and performance of wall during deep excavation based on numerical investigations and empirical relationships as (Mana and Clough 1981; Carder 1995; Hashash and Whittle 1996; Wong et al. 1997; Hseih and Ou 1998; Long 2001; Yoo and Lee 2007 and Hong et al. 2014). Many studies presented the effect of lateral displacement of retaining wall under different site conditions with mainly discussed about the factor influence on the maximum lateral displacement including depth of excavation, type of retaining wall, soil stiffness, support stiffness, soil conditions, system geometry and method of construction as (Fernie and Suckling 1996; Ou et al. 1998; Yoo 2001; Kung 2009; Li and Lehane 2010). In supplement, despite there have been many studies on the performance of wall and explain wide range of parameters about excavation and retaining wall but still it is necessary to understand the ground deformation zone during successive excavation for design considerations.
In present study, the image processing technique PIV is used to check the performance of deep excavation under different ground conditions by considering the effect of soil relative density, water table effect and further two different bending stiffness walls are used called as model soil cement hybrid (CS-H) wall and cast in place (CIP). The results are thoroughly presented to check the application of PIV technique for performance of deep excavation in laboratory.
2. Particle Image Velocimetry (PIV)
GeoPIV is the MATLAB module to measure the soil deformation in geotechnical models using particle image velocimetry (PIV) technique developed by White et al. (2001a). It is known as particle image velocimetry (PIV) as the technique is being used to measure the velocity of seed particles, basically it is developed by Adrian (1991) for the particle movements in fluid mechanics. It had become routine experimental practice in many geotechnical research laboratories around in 21st century and it had been studied by many researchers (e.g., White et al. 2001a, 2001b, 2003; Take 2015; Rechnmacher and Finno 2004). GeoPIV is free image analysis module for MATLAB designed program. It is capable of sub pixel resolution measurement for problems occurring in large displacements and deformations. All the files on GeoPIV run directly from MATLAB command line and has been designed for efficient batch processing of image data. GeoPIV analyze the digital images captured during the test and show the deformation of particles in form of vector along the failure mechanism. The images are usually analyzed in sequence, starting with initial reference Image. The de-formation of particles is being found as the sum of many small deformations. There are different techniques to analyze the images in GeoPIV like, meshing the image and by placing the targets along the failure etc. In present research, a number evenly spaced targets were placed on the front face of test box to calculate the ground deformation along the wall during the excavation. The conceptual drawings to analyze the images for ground deformation using PIV are shown in Fig. 1 (White et al. 2003). Actually in geoPIV analysis need to increase the texture of image for analysis (White et al. 2003) but in present study as the target point was used along the front face and analysis was run through target point, so there was no need to increase the texture of ground.
3. Laboratory Deep Excavation Modeling
A series of laboratory model tests were performed with due consideration of PIV analysis to check the per-formance of deep excavation. Details of the model tests and the results are given in the subsequent sections.
3.1 Test setup
3.1.1 Test box configurations
The series of laboratory model test box experiments were performed in a test box made of transparent plex-iglass to easily observe the soil movement and wall deformation by using PIV. The model tests were per-formed using 0.8m high model wall constructed in a test box, having dimensions of 1.20 m x 0.44 m in plan and 0.8 m in height, made of 3 cm thick Plexiglas as shown the schematic view in Fig. 2(a) and test box used in this study shown in Fig. 2(b). The test box was made sufficiently rigid by using steel edge beam to maintain the plane-strain condition during test. 0.2 m Space for excavation and 1.0m backfill kept constant during all test cases. The possible friction between the inside wall of test box and artificially created model ground were minimized by using WD-40 spray along the inside walls of test box. The model ground was created with a special raining technique for all test cases to achieve the required relative density. All the tests were performed to check the appli-cation of PIV for the determination of ground deformation zone during the deep excavation under different ground conditions as well as wall stiffness.
3.1.2 Saturation process
For saturation purpose, a box was used having same dimensions as dimensions of test box in plan and 30 cm height, made of 2 cm plexiglass as schematic view of rainfall box shown in Fig. 3(a). The saturation was simulated by spraying water at the top of the backfill as well as excavation side using spray shower with 15 Horsepower (HP) compressor and a 20 Watt (W) stepping motor having flow capacity 0.06∼2300 mL/min with 0.1∼600 revolution per minute (RPM) as shown in Fig. 3(b). The saturation simulation process used in this study shown in Fig. 3. To select the RPM value of motor for fully saturation of ground, 1st check the quantity of flow at different RPM values and check the flow quantity of drain water to check the same inflow and outflow in mesh cylinder at specific time duration and 500 RPM value of motor were selected for 3 hour duration of water spray to get the fully saturate ground.
3.1.3 Wall construction
In present study, two different bending stiffness walls are considered with different cross-section known as developed model CS-H which is hybrid from CIP_SCW and typical cast in place (CIP) wall to check the de-formation zone of ground with PIV during the excavation. The high bending stiffness double section wall created by overlapping the columns known as developed CS-H wall while the low bending stiffness
with single cross-section known as CIP wall and the cross-section of both type of wall along with schematic view used in this study shown in Fig. 4.
For the construction of model CS-H and CIP wall for laboratory experiments first created the formwork for curing of concrete wall by using PVC pipes as per above given section of CS-H and CIP wall as shown the top view in Fig. 5 for CS-H and CIP wall and the construction procedure of concrete wall along with formwork used for curing of concrete wall shown in Fig. 6(a) and (b).
After this formwork embedded into the ground before pouring of concrete paste to keep the formwork safe in case of lateral deformation. The paste of cement sand was made with mix ratio of 1:4 and mixed with 40% clean water along with 2% accelerator for smooth mixing. After that insert, the paste of cement sand into the already created formwork with compaction as shown in Fig. 6(a). After pouring concrete paste trim the surface with spatula to make the flat surface and left the concrete wall for 18 hr curing time. After 18 hr open the formwork and used the wall as shown in Fig. 7(a) and (b) for experiment. To keep the constant stiffness of wall, the wall was made for each experiment separately with constant curing time of 18 hr.
3.1.4 Strut preparation
Strut was made with 10 mm thick plexiglass, steel bar and spring to support excavation load. The geometry of strut along with strut used in this study shown in Fig. 8(a), (b) and (c).
3.2 Monitoring of deep excavation performance
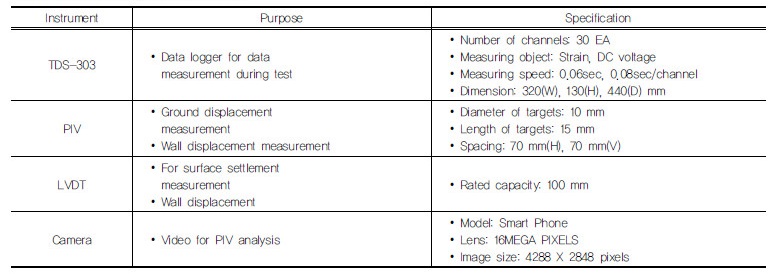
To check the deep excavation performance during ex-cavation, the wall displacement, ground displacement (Horizontal as well as vertical), and ground deformation was properly monitored by using PIV technique with targets on front face of ground. To perform the PIV analysis for ground excavation all the images were taken with smart phone with a resolution of 16 Megapixels. The camera was located at 1.0 m away from the test with its optical axis at right angle. The geometric correction was adopted by considering the error induced by camera lens as suggested by (Mehdi et al. 2016). As the size of view field for model test box was 1000 X 750 mm and the size of image was 4288 X 2848 pixels. So, for lens accuracy the scale of view filed was determined to be 0.234 mm/pixels. The camera setup and targets point arrangements along the front face of test box wall shown in Fig. 9. Further to check the accuracy of PIV analysis the LVDT with rated capacity of 100 mm and TDS-303 data logger was used to collect the measured data during test. The schematic view of all these monitoring sensor and detail arrangement of test setup shown in Fig. 10 and instrument used in this study along with purpose given in Table 1. The results of ground settlement measured with LVDT and by PIV analysis has only less than 1% difference, therefore, the accuracy of PIV analysis was considered to be acceptable in present study.
3.3 Procedure to use the PIV
There was following procedure used to run the PIV analysis and to draw the vector and contours plot for successive ground deformation during deep excavation. To run the analysis the MATLAB command line was used by using following procedure. i) locate the image list in MATLAB the subroutine was used “imagelistcopy (‘imagelist.txt’). ii) Select the targets point to run the analysis by using command line ”geoTAGuv (‘mesh.txt’, 100) where 100 is the mesh boundary. iii) Run the analysis by using command “geoPIV8” and the data for each image with reference to initial reference image was save automatically in WordPad format in selected to directory to carryout further analysis. iv) Once the geoPIV analysis finished, the extracted date was used to draw the vector and contours plot by using Surfer program. v) Create the worksheet in surfer by using geoPIV analysis data. vi) Click on contours and vector icon in surfer to draw the contours and vector plots by selecting the created worksheet and set the plot format. The working procedure of geoPIV is very easy and user friendly to determine the deformed field.
3.4 Material used
3.4.1 Model ground
Model ground prepared by using fine sand with an effective particle size (D10) 0.44 mm, the coefficient of uniformity (Cu) 1.41 and the coefficient of curvature (Cc) 0.92. All these properties were obtained by performing geotechnical property test and the grain size distribution curve shown in Fig. 11. The soil used for model ground preparation classified as poorly graded sand (SP) based on unified soil classification system (USCS).
Model ground prepared with different relative density of 50% and 70% with effective unit weight of 16 kN/m3 and 18.24 kN/m3. Large scale direct shear tests were performed to investigate the shear resistance parameter of sand. Three tests at normal pressure of 100, 150 and 200 kPa were done to draw the failure envelope. From the results of the direct shear test, the cohesion of sand c = 0 kPa and friction angle = 38 degree as shown in Fig. 12.
3.4.2 Concrete wall
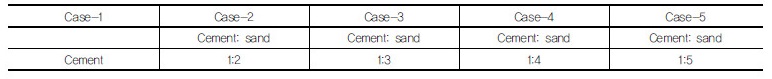
The concrete wall constructed with cement sand ratio of 1:4 on the bases of compressive strength test. For construction of concrete wall, a Portland cement was used along with fine sand. For proper mix ratio, a compressive strength test was performed at mix ratio of 1:1, 1:2, 1:3, 1:4 and 1:5 with 40% of cement water was mixed to make the paste along with 2% accelerator for smooth mixing and from results mix ratio 1:4 was selected for model wall. Detail of compressive strength tests are given in Table 2. The compressive strength results are shown in Fig. 13.
3.5 Test Procedure
3.5.1 Model ground preparation
The model ground was prepared using fine sand by raining technique with specified hopper system. Before the start of the real test, a series of trail test were performed to investigate the specific height of raining to obtain the desired relative density of 50% and 70%. In each trail test, a small aluminum cup with known volume was placed at the different location of test box to calculate the relative density. To obtain the consistent sand density of model ground the discharge rate and discharge height were carefully controlled during raining of sand for the preparation of model ground.
Before preparation of the model ground, the sides of test box were washed with WD-40 spray to reduce the side friction. After this placed the wall into the test box as per instrumentation program and start to create model ground using raining technique. A number evenly spaced targets with 70mm spacing in the horizontal as well as vertical direction were placed on the front face of test box to calculate the vertical as well as horizontal ground deformation during excavation by using PIV. The model ground was created with same soil layers on both side backfill as well as excavation side to restrain the wall movement before excavation. The detail model ground preparation step by step shown in Fig. 14.
3.5.2 Excavation procedure
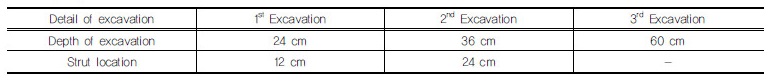
The 0.6 m deep area was excavate in three steps and after each excavation step the strut was installed as per given excavation depth. The schematic view of each excavation step along with strut location shown in Fig. 15. The detail Excavation depth and strut location given in Table 3. Where in excavation procedure steps, the Hex mean excavation level and Sst mean strut level for excavation and sturt installation.
3.6 Parametric study
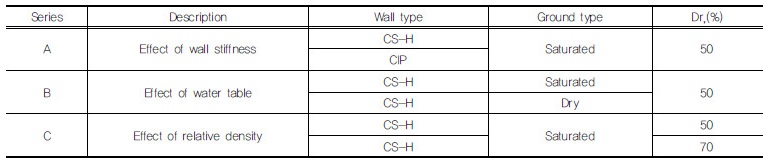
Ground excavation test cases are developed with due consideration of the objectives of the study, i.e., to check the application of PIV for evaluating the performance of deep excavation. In order to meet the objectives, three sets of tests are performed, i.e., by considering effects of different wall stiffnesses for the CS-H and CIP wall, ground relative density and water table. Total six experiment cases were performed in laboratory by considering above test conditions to check the analysis results of PIV and test cases are summarized in Table 4.
4. Results and Discussion
Results of above mentioned test cases are presented in term of contours and vector plot based on PIV analysis data by using surfer application and monitored the performance of deep excavation. Further based on PIV analysis data the ground displacement profile (Vertical as well as horizontal) and wall displacement profile was also drawn to check the performance of deep excavation under different ground and wall stiffness conditions and results of all three-series shown below in subsequent section.
4.1 Effect of wall stiffness
To check the ground deformation behavior by using PIV technique, the two test cases were performed in laboratory with different bending stiffness walls called as model CS-H and CIP wall. To check the ground deform-ation toward excavation, the contours and vectors are plotted at each excavation stage. By using PIV (particle image velocity meter) technique to obtain the ground deformation data at each stage of excavation and by using PIV data contours and vectors are plotted by surfer at each excavation stage as given below in Fig. 16 for model CS-H and CIP wall ground deformation vector while in Fig. 17 shows the contour plot for both CS-H and CIP wall. From results of vector magnitude and contours color combination it is clearly seen that, model CS-H wall has much smaller ground deformation as compared to CIP wall which is because of high stiffness of CS-H wall. From results, it is also observed that, ground deformation increases along the depth of excavation for both CIP and CS-H wall. From these results it is investigated that, PIV technique is quite useful for the demonstration of ground excavation. In below given contours and vector plot 1st or 2st mean first or second strut and 1st Exca or 2nd Exca mean 1st or 2nd excavation stage respectively.
Further based on PIV analysis data, the wall dis-placement and ground displacement profile (horizontal as well as vertical) were drawn to check the behavior of CS-H and CIP wall as shown in Fig. 18. From results, it is clearly seen that, CS-H wall have significant im-provements in term of displacement as compared to CIP wall. Ground and wall displacement notably decreases in case of model CS-H wall as compared to CIP wall. Also from results it is seen that, ground displacement as well as wall displacement increases with the depth of excavation and highest displacement observed 3.38 cm in case of CIP wall and 2.29 cm in case of CS-H wall at the final stage of excavation up to 0.6 m.
From above results of ground displacement and ground deformation in form of vector and contours plots based on PIV analysis, it is investigated that, PIV is useful technique to measure the ground deformation zone during the excavation. From above given results, it is clearly seen that, in case of CIP wall maximum ground dis-placement, wall displacement as well as ground deformation are observed as compared to developed model CS-H wall which is because of small stiffness of CIP wall. Where, the model CS-H wall has large stiffness because of double section which can restrain maximum ground displacement during excavation.
4.2 Effect of ground water table
To check the performance of PIV analysis by considering ground water table effect, the two test cases were performed in laboratory by using CS-H wall with saturated ground and dry ground. The results are presented in a same manner as in case of effect of bending stiffness of wall. Fig. 19 shows the vector plot for ground deformation with successive excavation under dry and saturated ground while the Fig. 20 shows the contours plot to demonstrate the ground deformation for both dry and saturated ground. From results of contours and vector plots, it is observed that, the dry ground has much smaller ground deformation as compared to saturated ground and which is according to general scenario of ground ex-cavation performance during dry and saturated ground. As in case of saturated ground, there is high ground pressure on wall because of water pressure on wall during excavation which cause for high ground displacement towards excavation and PIV also shows the same trend.
Fig. 21 shows the wall and ground displacement at each excavation stage for both dry and wet ground and from given results it is seen that, ground excavation performance is much better in case of dry ground as compared to saturated ground. From these results, it is investigated that, the ground excavation during the high- water table need much intention as compared to dry ground. So, care should be taken during the excavation under high water table.
From above results, of vector and contours plot of ground deformation and ground and wall displacement profile during dry and saturated ground, it is seen that, the ground excavation performance is much better in case of dry ground as compared to saturated ground. Which is because of high pressure of water table on wall, which exerts the pressure on the wall and which cause for high ground deformation as compared to dry ground. PIV results properly shows the ground deformation zone during successive excavation, which shows that, the PIV technique is good tool for prediction of ground deformation zone.
4.3 Effect of relative density
To check the performance of PIV for the prediction of wall, ground displacement and ground local deformation during the excavation under different ground stiffnesses, two test cases were performed with soil relative density of 50% and 70% using CS-H wall under saturated ground condition. The results of ground displacement as well as wall displacement with ground deformation for both type of ground is given in following sections.
Ground deformation zone in term of vectors and contours plot for both 50% and 70% relative density shown in Fig. 22 and Fig. 23 respectively for vector and contours plot. Fig. 24 shows the wall and ground displacements profile at each excavation stage. From results, it is clearly seen that, deep excavation performance in case of 70% relative density is much better as compared to 50% because of low stiffness of ground in case of 50% relative density.
From above given results, based on PIV analysis, it is investigated that, the deep excavation performance much better with high stiffness ground i.e. Dr = 70% as compared to Dr = 50%. From above given results, it is also investigated that, the PIV technique for the prediction of ground and wall performance during deep excavation is useful tool and one can easily use to define the de-formation zone of ground towards excavation and also for design considerations.
4.4 Results analysis
To check the accuracy of geoPIV analysis results, the PIV analysis results were compared with measured results of ground settlement and wall displacement using LVDT. From results it is seen that, the maximum ground settlement and wall displacement results based on PIV analysis and from measured results have only less than 1% difference as the results are shown in Fig. 25 for all above series. So, from results, it is concluded that, the accuracy of PIV analysis results is acceptable to predict the ground and wall displacement field. From analysis results, it is also seen that, the performance of CS-H wall is much better compared to CIP wall and from observed results it is also seen that, the ground settlement is larger as compared to wall displacement during excavation.
5. Conclusions
In this paper, a series of model test box experiment were performed in laboratory to check the use of PIV application for evaluating the performance of deep excavation. To check the PIV results for ground de-formation during the successive excavation of ground, different test cases were performed considering the bending stiffness of walls with CS-H and CIP wall, effect of ground water table and effect of relative density for results comparison purpose. The results are presented in form of ground displacement (vertical and horizontal), wall displacement and ground deformation in form of vector and contours plot. Based on results of experimental study, the following conclusions are drawn.
(1)From above given results, it is investigated that, the PIV technique is a useful tool to observe ground deformation during the successive excavation to check the performance of deep excavation as the results of PIV analysis and measured results with LVDT have only less than 1% difference. The colors combination and magnitude of vector clearly define the deformation zone occur due to excavation.
(2)From the results of experiments based on bending stiffness of wall, PIV analysis clearly define the deformation zone in case of low stiffness CIP wall is much larger than the double section high stiffness CS-H wall. The deformation in case of CIP wall is higher because of low stiffness of wall which have small tendency to restrain the soil pressure compared to high stiffness CS-H wall during excavation.
(3)Similarly, ground deformation and wall displacement are much larger in case of saturated ground compared to those of dry ground because of higher pore water pressure in case of saturated ground which have caused for larger ground deformation.
(4)In case of effect of relative density, the ground deformation zone, ground displacement and wall displacement are higher in case of low relative density of 50% as compared to high relative density of 70%. Because high relative density makes the ground stiff, which have small movement during the ground excavation and PIV results in form of contours and vectors clearly demonstrate this behavior. So, from these results, it is concluded that, PIV technique is very useful in laboratory experiment to help under-standing the behavior of ground.
