

1. Introduction
2. Theoretical Background and objectives of the study
3. Mini-Cone Penetration Test (Mini- CPT) Procedure
3.1 Mini-CPT Components
3.2 Measurement Method
4. Mini-CPT Test
4.1 Mini-CPT Calibration
4.2 Mini-CPT Penetration test model
4.3 Soil Properties
5. Result and Discussion
5.1 Cone Penetration resistance
5.2 Comparison with Empirical Formula
6. Conclusion
1. Introduction
Experimental studies conducted on large-scale model soils in the laboratory are typically complemented by numerical analysis to understand mechanical behavior of soils. To facilitate comparisons between laboratory experiments on model soils and numerical simulations, having a deep understanding of the mechanical properties of the model soil, such as cone resistance, relative density and shear wave velocity, is crucial. However, these properties are generally estimated based on data obtained from basic soil property tests conducted before the construction of the model soil, including compaction tests, sieve analysis tests, and specific gravity tests, to predict the layer-specific properties of the model soil. To obtain continuous these soil properties, a mini-cone penetration test (CPT) for model soils was developed, emulating the conventional CPT used in field applications. The manufactured CPT apparatus was equipped with a load cell for measurement purposes, allowing for the correction of cone penetration resistance values. Furthermore, this study aimed to evaluate the influence of the boundary effect at the interface between layers during CPT penetration, depending on the penetration point.
2. Theoretical Background and objectives of the study
The cone penetration resistance obtained from CPT experiments can be applied using foundation bearing capacity models commonly applied to sandy soils. The measured cone penetration resistance in sandy soils exhibits continuous results, spanning from low confining pressures to high confining pressures. During cone penetration, the behavior of shallow and deep foundations occurs sequentially.
Vesic (1972a) classified the failure modes of shallow foundations based on soil com-pressibility and shear strength characteristics, distinguishing them into general shear failure, local shear failure, and punching shear failure. In accordance with Terzaghi’s model, it is generally observed that dense sandy soils exhibit expansive behavior, resulting in general shear failure, while loose sands tend to undergo compression behavior, indicating punching shear failure modes. In this context, the soil density becomes a critical factor determining whether contraction or expansion behavior dominates.
Similarly, the behavior of the surrounding soil during cone penetration into soil with uniform density is influenced by soil contraction/expansion behavior, depending on con-fining stress levels. This behavior, in turn, affects the cone tip resistance. At shallow depths with low confining stresses, the soil particles around the cone tip typically exhibit expansion behavior, leading to heaving of the surrounding soil as the failure surface ex-tends from the cone tip to the surface. As the depth of cone penetration increases, the cone penetration resistance follows a parabolic increase.
When the cone is continuously advanced into the ground in a cylindrical manner, the failure surface originating from the cone tip extends to the surface, forming a cylindrical shape. Biarez and Gresillon (1972) assumed a cylindrical failure surface when considering the friction of the failure surface in sandy soils due to cone penetration. They provided the following expression for cone resistance, accounting for friction:
Here, : Cone penetration resistance (kPa)
: Unit weight of the sand (kN/m3)
Here, : Effective friction angle of sand (°)
: Depth of cone penetration from the ground surface (m)
: Non-dimensional bearing capacity factor (under axisymmetric conditions) (Le Gall., 1966)
: Dimensionless coefficient determining the friction of the cylindrical failure surface
: Dimensionless coefficient determining the friction of the cylindrical failure surface
Here, : Cone diameter (cm)
The non-dimensional bearing capacity factor under axisymmetric conditions is theoretically larger than the Terzaghi-Prandtl 2D condition and is expressed as (Biarez and Gresillon, 1972):
Here, the cone diameter B is so small compared to the base that the first term can be neglected, so Equation (1) can be reduced to:
Puech and Foray (2002a) reported that the dimensionless coefficient K, based on the interpretation of field cone penetration test results in siliceous sandy soils, varies between 0.5 and 4. They found that the value of 0.7 yielded the most similar results. Using Equation (5), it can be observed that the cone penetration resistance measured near the ground surface exhibits the following characteristics under axisymmetric conditions: 1) it increases parabolically with the depth of cone penetration, 2) it is proportional to the friction angle of the sandy soil, and 3) it is inversely proportional to the cone diameter. These phenomena have been confirmed through various experimental studies (Puech and Foray, 2002b; Tufenkjian and Tompson, 2005).
As the cone advances from shallow to deep depths, the high confining pressure surrounding the cone tip induces a transition from expansion to contraction behavior in the soil. During this transition, the failure surface that was initially connected to the surface becomes confined to the vicinity of the cone tip, resulting in localized failure. The cone penetration resistance reaches a critical state as it approaches the critical depth. Upon reaching the critical state, the tip resistance remains relatively constant, exhibiting only minor increases with continued cone penetration, primarily depending on the confining stress, while maintaining a quasi-static state (Meyerhof, 1976). Vesic (1972b) proposed a model for the quasi-static state of tip resistance using a cavity expansion theory, considering localized yielding behavior and a nonlinear Mohr-Coulomb failure envelope around the cone tip when the pile is advanced to greater depths.
Through this theoretical background, many researchers have conducted cone penetration tests in the laboratory to compare with field experiments or have carried out experiments on model grounds prepared in the laboratory. Gui and Bolton (1998) not only analyzed the effects when conducting CPT experiments through a centrifuge model test but also concluded that a CPT can be regarded as a scaled-down pile. Their findings suggest that the tip resistance of a CPT offers the best starting point for designers of full-scale driven piles. However they noted that the bearing capacity of short piles must be reduced in relation to the critical depth of the formation, which can be explored in simple centrifuge tests, emphasizing the importance of interpreting CPT data, especially in the design of full-scale structural foundations. Bolton et al. (1999) conducted comparative analyses through observations from CPT measurements in sand grounds using centrifuge model testers in various laboratories. Puech and Foray (2002a) presented a method for interpreting the results of cone penetration tests in the laboratory and analyzed the results using the cone penetration resistance measured in the field. Mohammad et al. (2013) presented results from laboratory CPT on unsaturated sand, demonstrating an increase in cone penetration resistance due to suction, and highlighted the necessity of considering suction in the assessment of soil properties. Kim et al. (2016) analyzed the effects of cone diameter according to scaling laws depending on the g-level in model grounds using a centrifuge model tester. Carey et al. (2018) newly developed a CPT for liquefaction experiments and validated it by conducting tests at various relative densities in eight centrifuge centers.
The objectives of this study are to:
1. Examine the differences in cone penetration resistance due to varying CPT penetration rates;
2. Assess the influence of the distance between the CPT and the sidewall;
3. Evaluate the influence of the distance between two penetration points;
4. Compare the cone penetration resistance using empirical formulas;
Objectives 1 to 3 involve examining the influencing factors on cone penetration (as per Gui and Bolton, 1998) by conducting experiments in a model soil box. The comparison of cone penetration resistance through empirical formulas was done using the model proposed by Biarez and Gresillon (1972). This approach of comparing estimated values with those measured in the laboratory has been widely used by many researchers (Puech and Foray, 2002a, Kim et al., 2013). Through this, the study aims to verify the influencing factors of CPT conducted in the model soil box and to evaluate the validity of the cone penetration resistance values using the estimated values derived from empirical formulas.
3. Mini-Cone Penetration Test (Mini- CPT) Procedure
In the field, the commonly used Cone Penetration Test (CPT) apparatus is designed with a diameter of 36.5 mm and a cone angle of 60°. It conducts measurements using a pore water pressure sensor, a sleeve friction sensor, and a cone resistance sensor. However, the Mini-CPT developed in our laboratory is a scaled-down version compared to the standard field CPT equipment, and is specifically engineered to measure only the cone penetration resistance. The following section provides a detailed description of the composition of the Mini-CPT developed in our research.
3.1 Mini-CPT Components
The Mini-CPT system is shown in Fig. 1 and was produced with reference to Kim et al. (2013). It consists of three main components: the cone, actuator, and data logger. The cone is attached to the actuator, which is connected to the controller for controlling the descent of the cone. Additionally, the cone is connected to the data logger to transmit the measured data from the cone to the computer. The actuator allows for penetration at speeds ranging from 1 to 20 mm/sec.
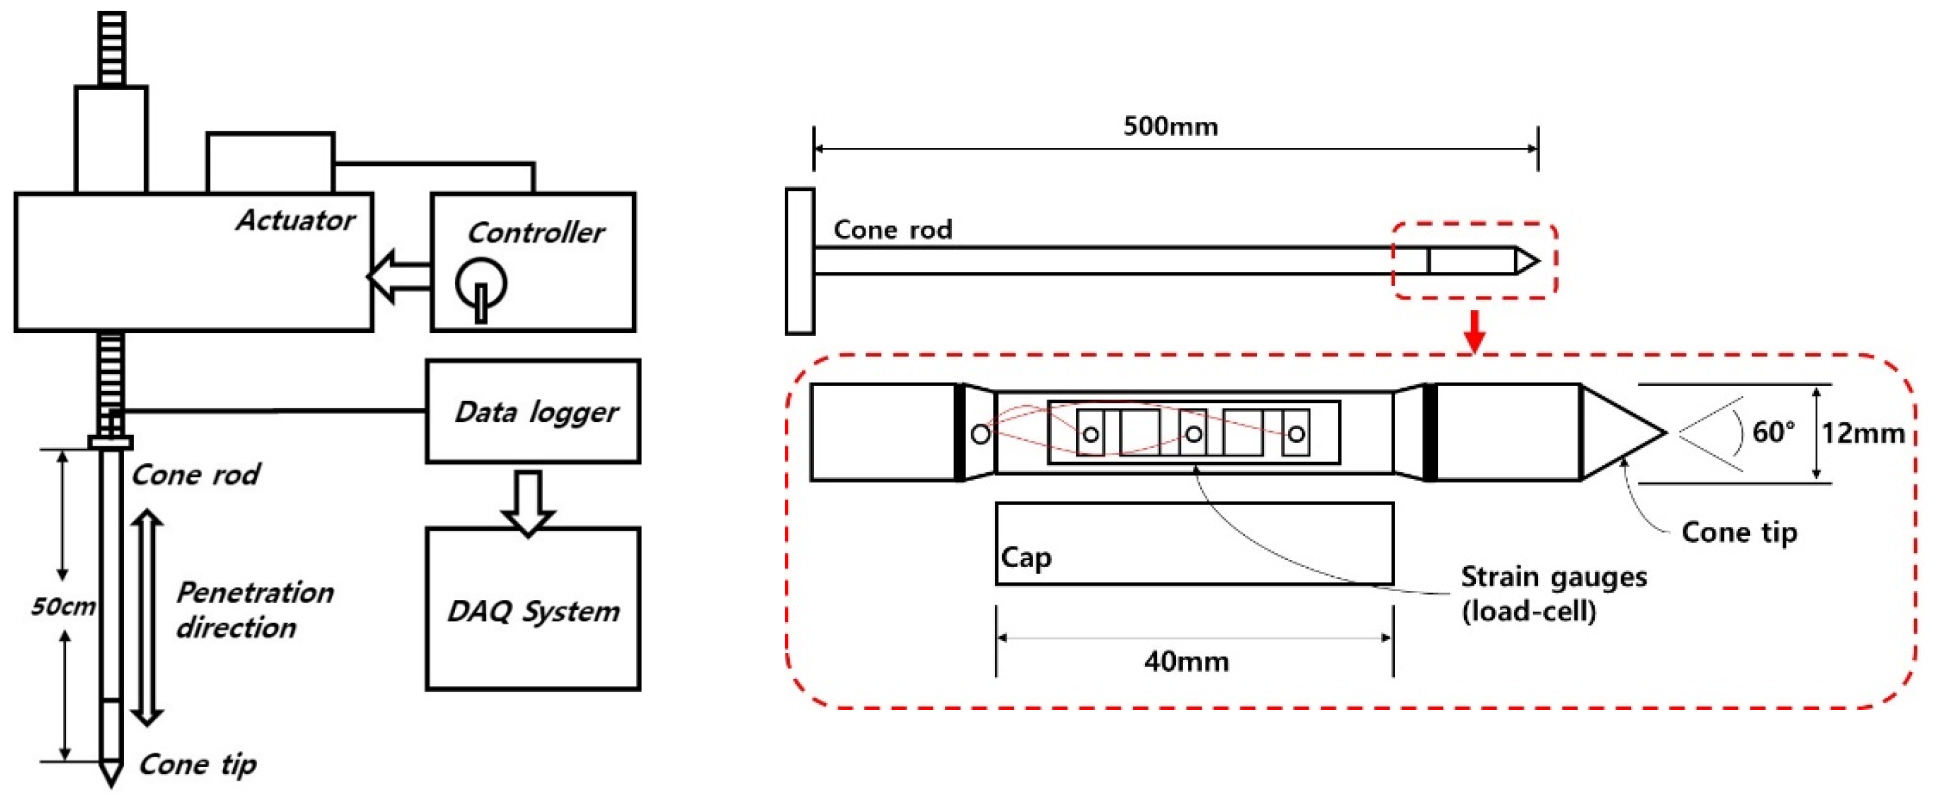
The cone is constructed with a total length of 500 mm, a diameter of 12 mm, and an angle of 60 degrees. To measure the cone penetration resistance, four strain gauges are affixed to the load cell portion of the cone in a 4-bridge configuration, covering all four sides. The upper part of the cone is designed in a rectangular shape for easy attachment to the actuator. Inertial measurements of the cone are obtained by utilizing the strain gauges attached to the four sides of the cell, providing measurements of the uncorrected cone penetration resistance. The cone penetration resistance obtained from CPT experiments can be applied using foundation bearing capacity.
3.2 Measurement Method
During Mini-CPT experiments, the determination of the penetration point and the experimental approach should consider four key influencing factors:
1. Cone penetration rate;
The penetration rate of the cone can be controlled by adjusting the actuator’s speed. For model soils composed of sand, the penetration rate is typically selected between 2.5 to 20 mm/sec. In this study, we primarily conducted penetrations at a rate of 20 mm/sec. Additionally, lower penetration rates were employed to assess their influence compared to the 20 mm/sec rate (Bolton et al. (1999)).
2. Boundary effect at the bottom;
Penetration should be completed with the cone positioned 10 times its diameter (10) above the base of the soil box (Been et al. (1986)).
3. Side wall effect;
Penetrations should be spaced at intervals of 11 times the cone’s diameter (11) from the model soil box’s sidewall (Been et al. (1986)).
4. Grain size effect ();
It is essential to employ a cone that is at least 20 times its diameter of the con larger than the mean particle size () of the model soil (Gui et al. (1998)).
These considerations ensure consistent and accurate Mini-CPT measurements, taking into account factors such as penetration rate, initial cone position, distance from the sidewall, and cone size in relation to the model soil’s particle characteristics.
4. Mini-CPT Test
4.1 Mini-CPT Calibration
Fig. 2 depicts the verification process using Mini-CPT and a load cell. The Mini-CPT was positioned at the center of the load cell and brought into contact before the measurement. The measurement was initiated with the cone descending at a rate of 1 mm/sec. After coming to a stop, the results obtained from the load cell and the Mini-CPT were compared to derive correction values.
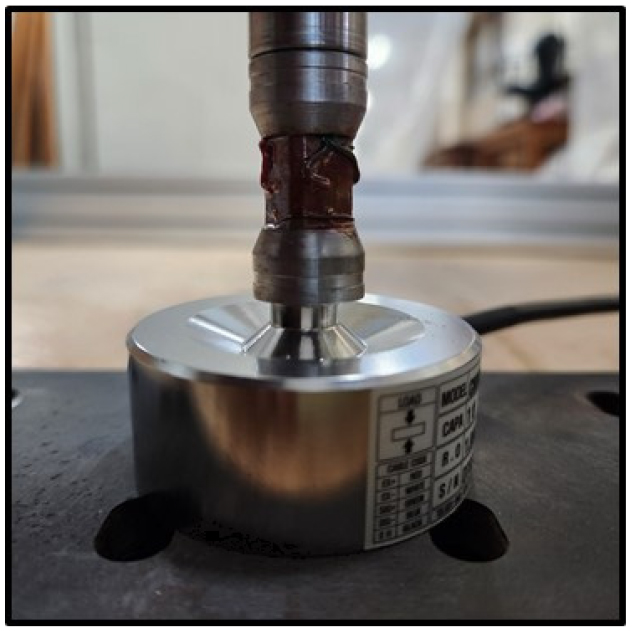
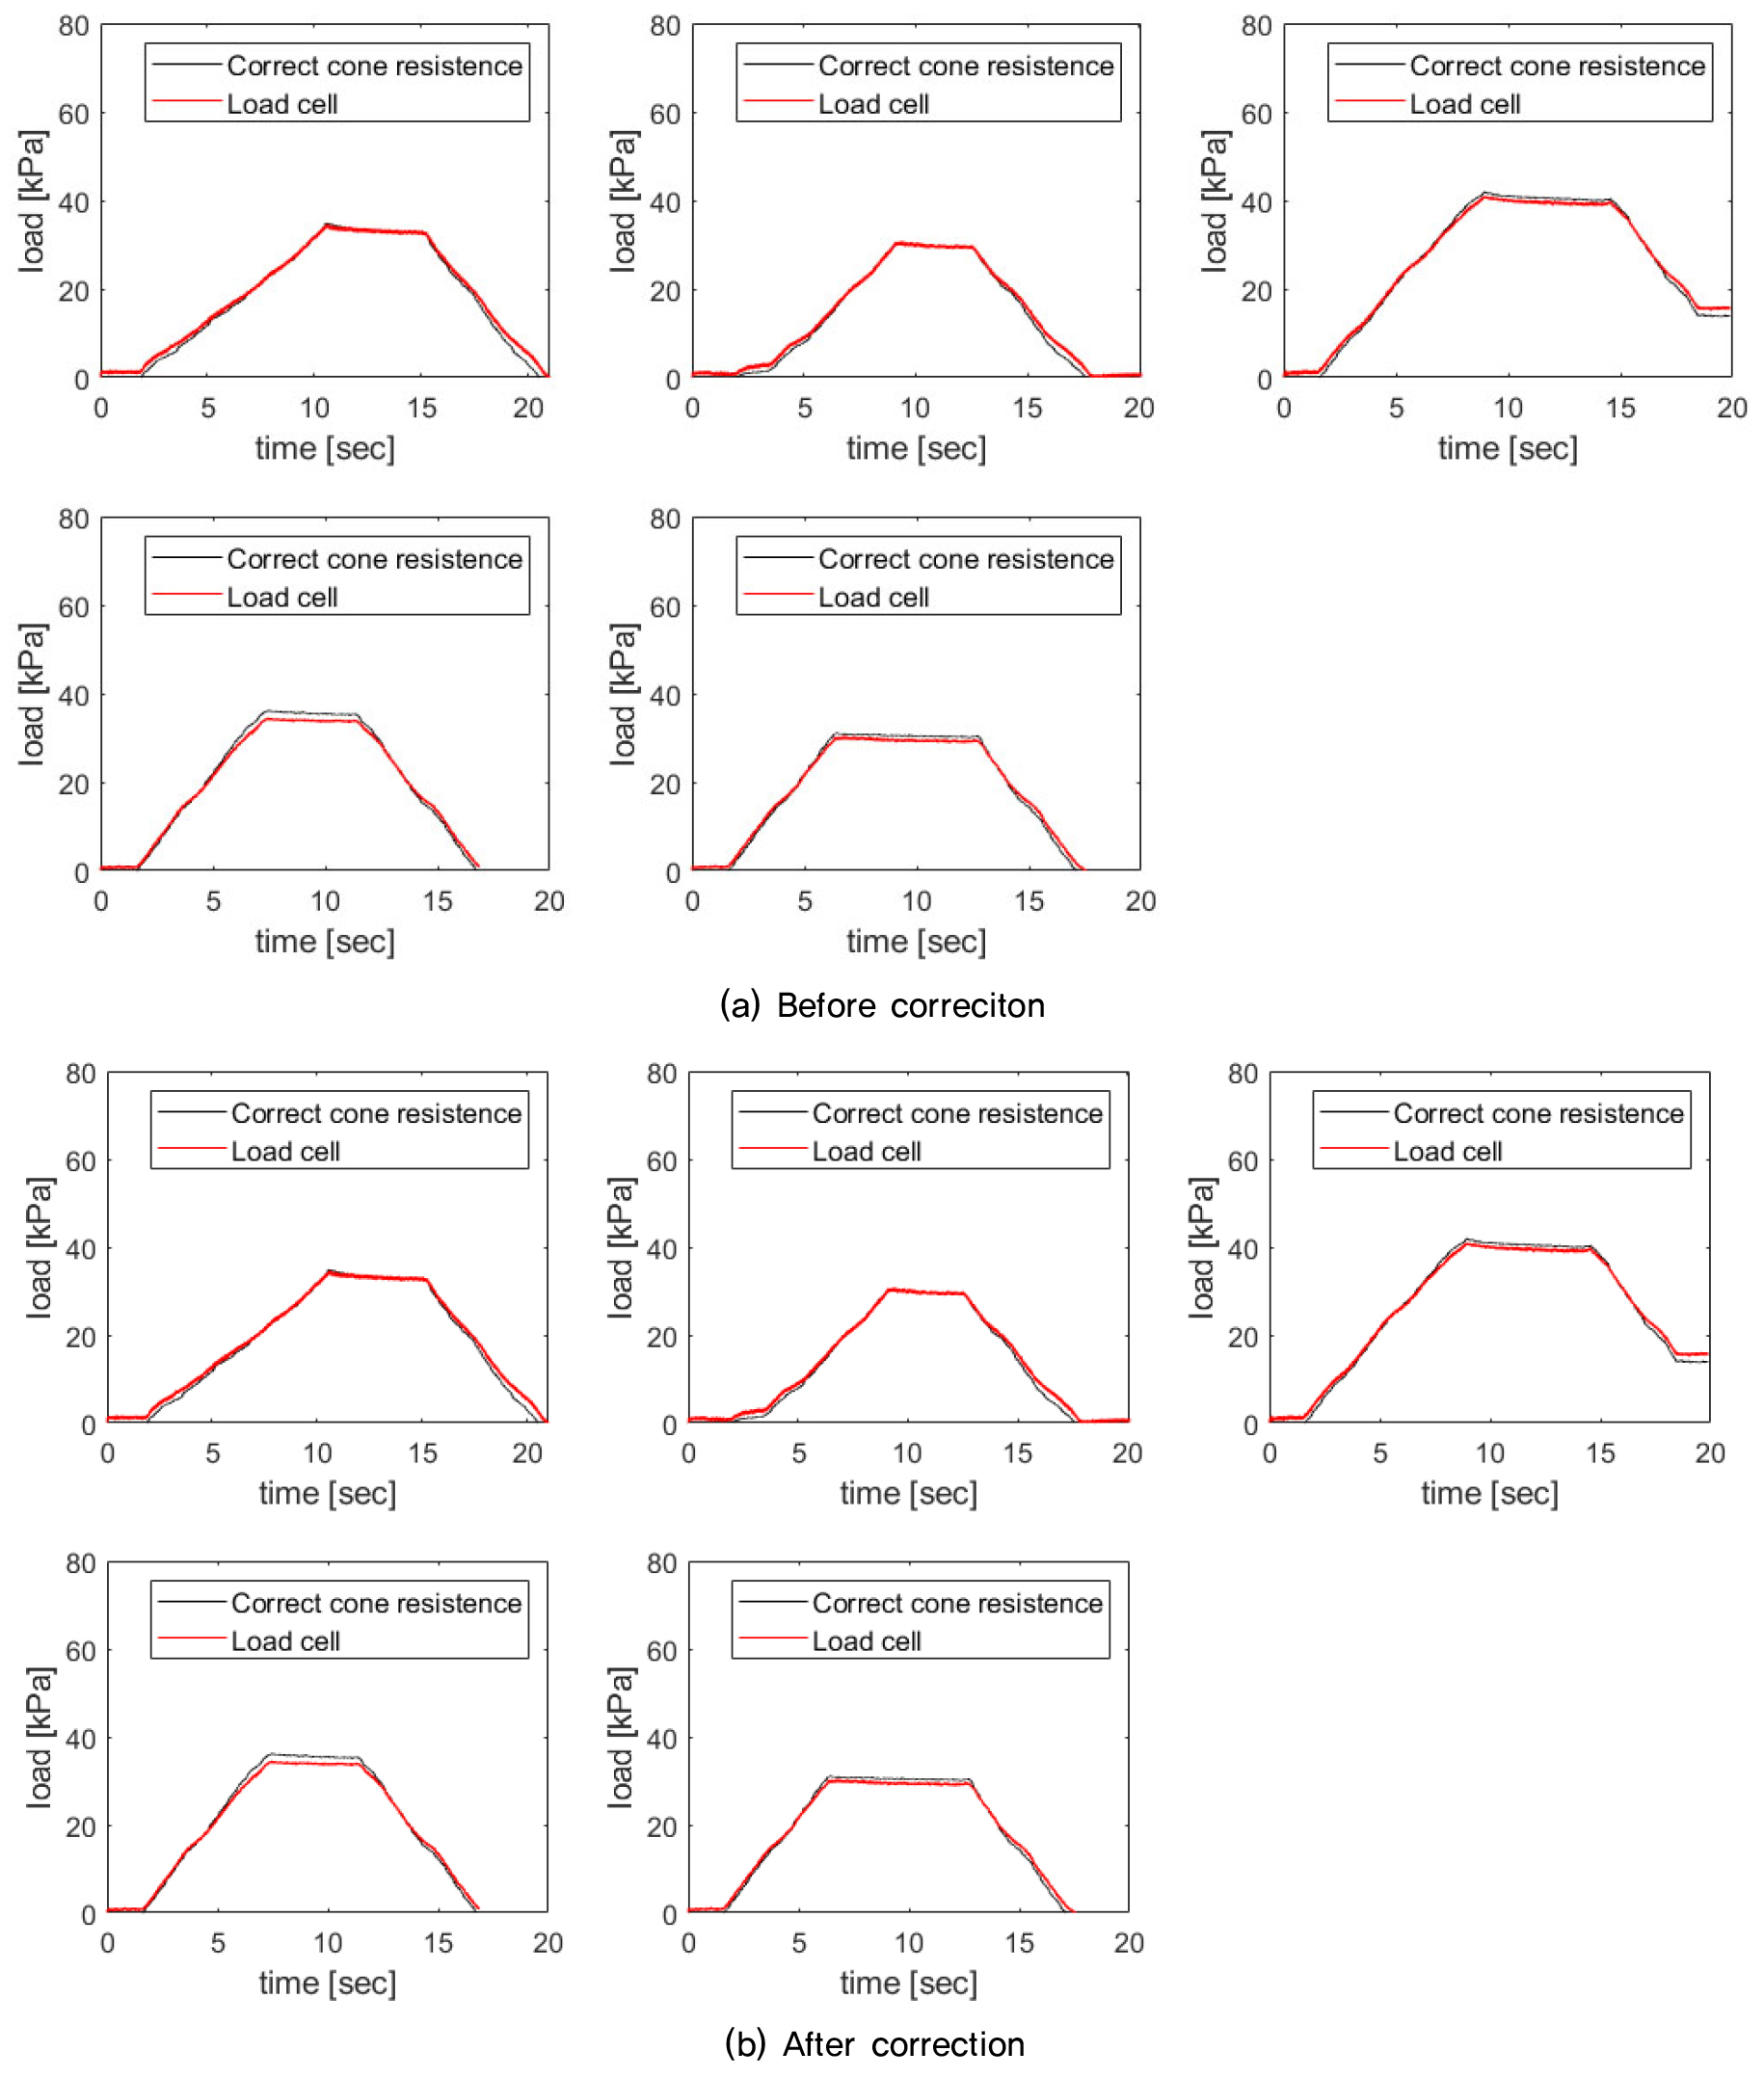
Fig. 3 presents the results obtained from deriving correction values based on Mini-CPT and Load cell measurements. A total of 5 measurements were conducted, and using the results obtained, the average of the values was calculated using Equation (6) to derive the correction values. The verification value derived through Equation (6) is 0.6598. Through these correction values, it was confirmed that the calculated results matched well with Fig. 3(b).
4.2 Mini-CPT Penetration test model
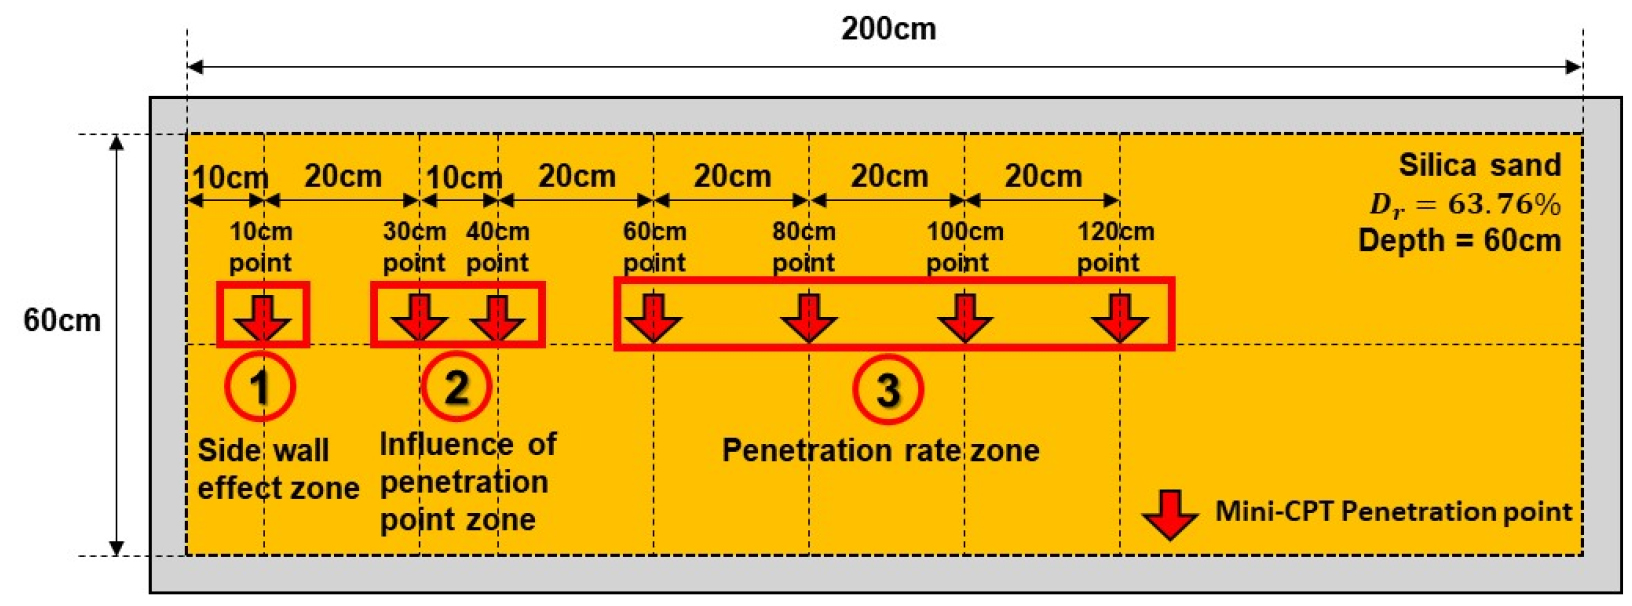
Fig. 4 the experimental plan for Mini-CPT penetration locations is depicted. The experiments were divided into a total of three zones, and each zone corresponds to the following cases. The soil box used in the study is 2 m long, 0.6 m wide and 0.6 m high, and it is made of acryl:
1. The influence of the soil box wall (side wall effect zone);
To investigate the influence of the soil box wall, measurements were conducted at a point located 10 cm away from the wall (100 mm distance, which is less than 11 times the cone diameter of 12 mm, i.e., 132 mm).
2. The influence of the cone penetration point (influnce of penetration point zone);
To assess the influence of the distance between two penetration points, measurements were conducted with a separation distance of 10 cm between the measurement points (100 mm distance, which is less than 12 times 10B, where 10B is 120 mm).
3. The influence of the cone penetration rate (penetration rate zone);
Measurements were conducted by varying the penetration rate at different penetration points to confirm if there was an influence of the penetration rate on the results.
Silica sand was used, and the composition was carried out as homogeneously as possible using the pluviation system. The relative density () of the model soil was 63.76%. This was done to ensure that the cone penetration resistance at different penetration points was measured as consistently as possible, with minimal variation. The penetration depth was limited to 40 cm, taking into account the boundary effect at the bottom.
4.3 Soil Properties
The silica used in the preparation of the model ground is clean sand, made from artificially crushed quartz. The physical properties of the silica used in the construction of the model ground are as shown in Table 1. The sample material being used has a specific gravity () of 2.65, an friction angle () of 38°, and is classified as SM (Silty Sand) according to the Unified Soil Classification System (USCS).
Table 1.
Soil properties
One factor to consider when performing a cone penetration test is the relationship between the cone diameter and the mean particle size () of the model soil. For Silica sand, which is commonly used in model soil preparations, with an average particle size of 0.235 mm, and with a cone diameter of 12 mm, the ratio 0.235/12 = 51.06 (). Therefore, it is appropriate to use a 12 mm cone for mini-CPT experiments with this sand.
5. Result and Discussion
5.1 Cone Penetration resistance
Fig. 5 displays the results of cone penetration resistance measurements. The influence of the first penetration zone, located at the wall surface (Zone 1), is represented by a black line, while the influence of the second penetration point (Zone 2) is shown as red lines. The influence of the penetration rate at the third penetration point (Zone 3) is represented by blue lines. It can be observed that the cone penetration resistance measured at a 10 cm distance exhibits a significantly higher value compared to the resistance at other points. This value is approximately four times higher than the average cone penetration resistance observed at other points, which is very erroneous cone resistance value. This clearly gives us insight into how far the CPT test should be performed in the soil box in order to avoid the boundary effect of the wall.
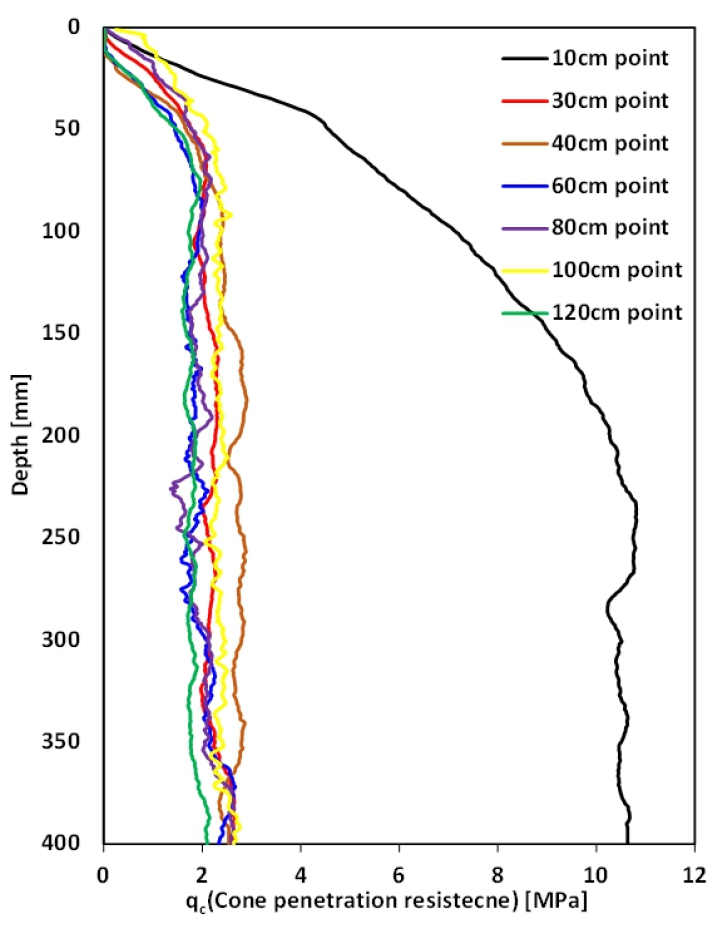
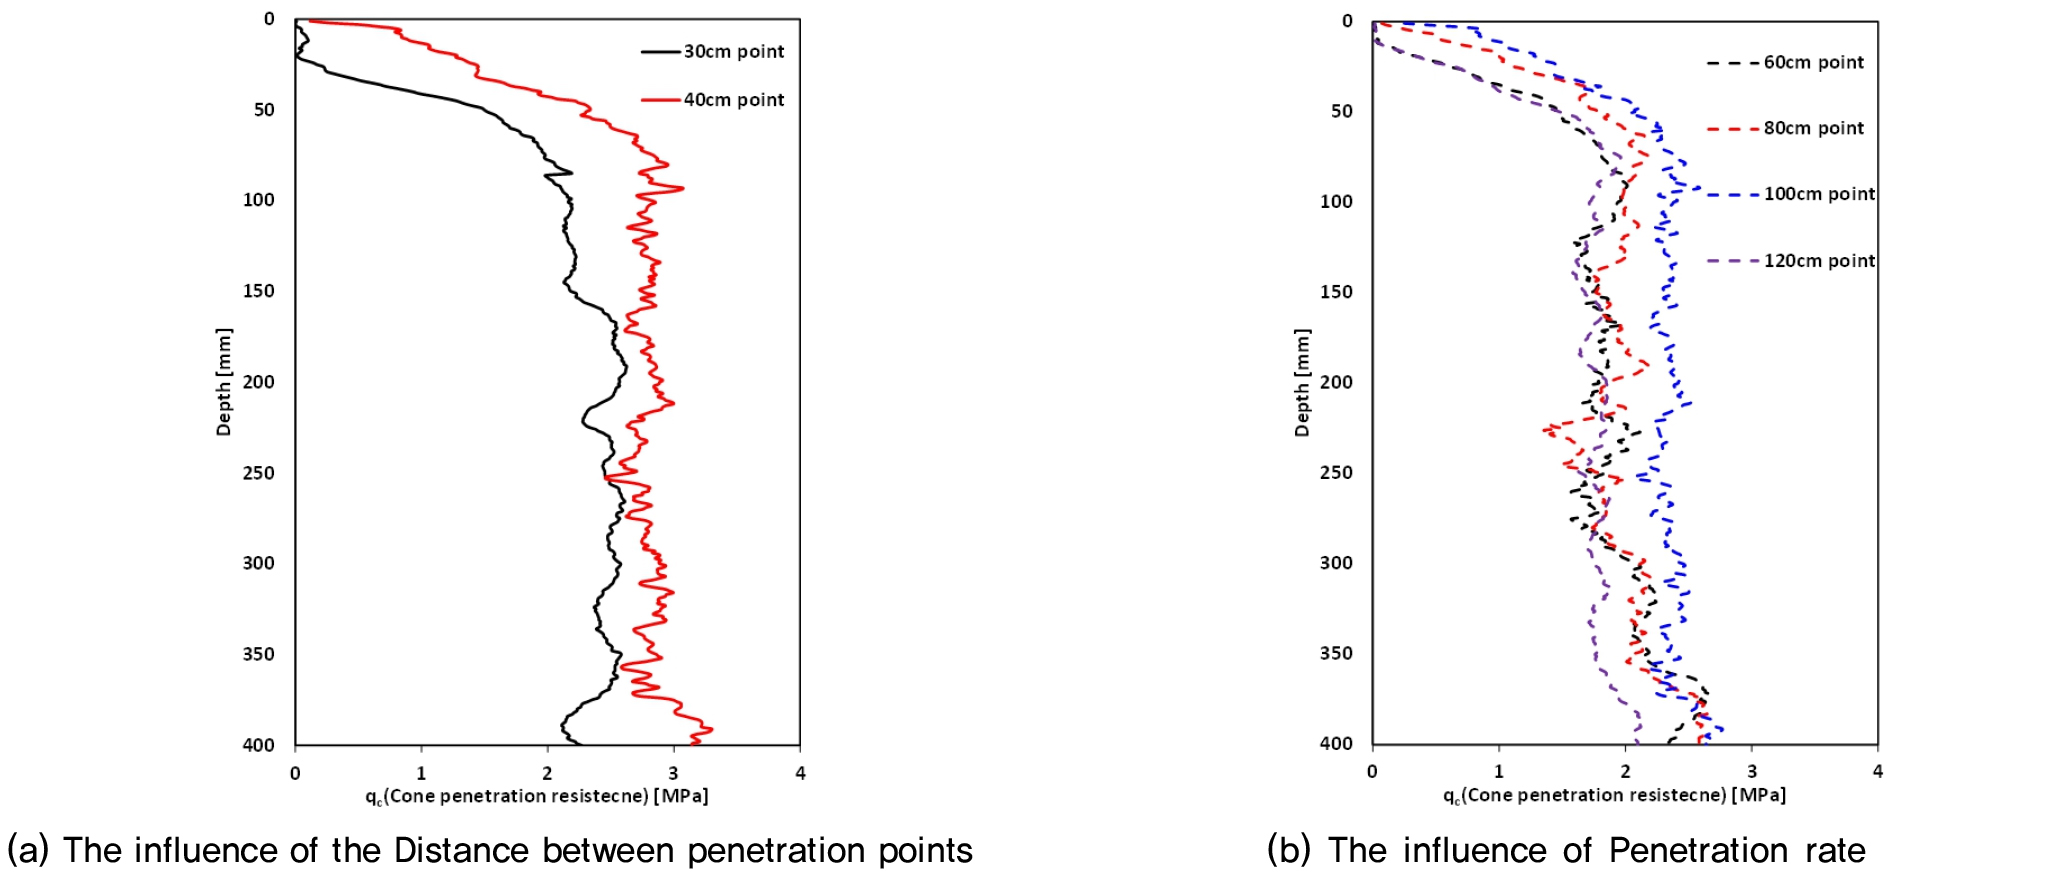
Fig. 6 represents the cone resistance values at each penetration point. Fig. 6(a) displays the results of penetration at the 30 cm distance followed by penetration at the 40 cm distance. It was observed that after penetrating at the 30 cm distance, the results at the 40 cm distance were generally about 22% higher on average. This is due to the densification of the neighboring sand around the Mini-Cone Test. It is confirmed that the distance between the test points should be long enough to avoid the boundary effect.
Fig. 6(b) illustrates the cone penetration resistance with respect to penetration rate. Penetration at the 80 cm point was conducted at a rate of 20 mm/s, the 100 cm point at 12 mm/s, the 120 cm point at 8 mm/s, and the 160 cm point at 4 mm/s. A comparison of the average cone penetration resistance at these four points showed slight differences of approximately 5% to 14%, indicating that the influence of penetration rate is relatively minor. It is considered that the velocity difference between 4 ~ 20 mm/sec has a minimal influence on the Mini-CPT. The observed difference of 5 to 14% is attributed to the variations in soil properties.
5.2 Comparison with Empirical Formula
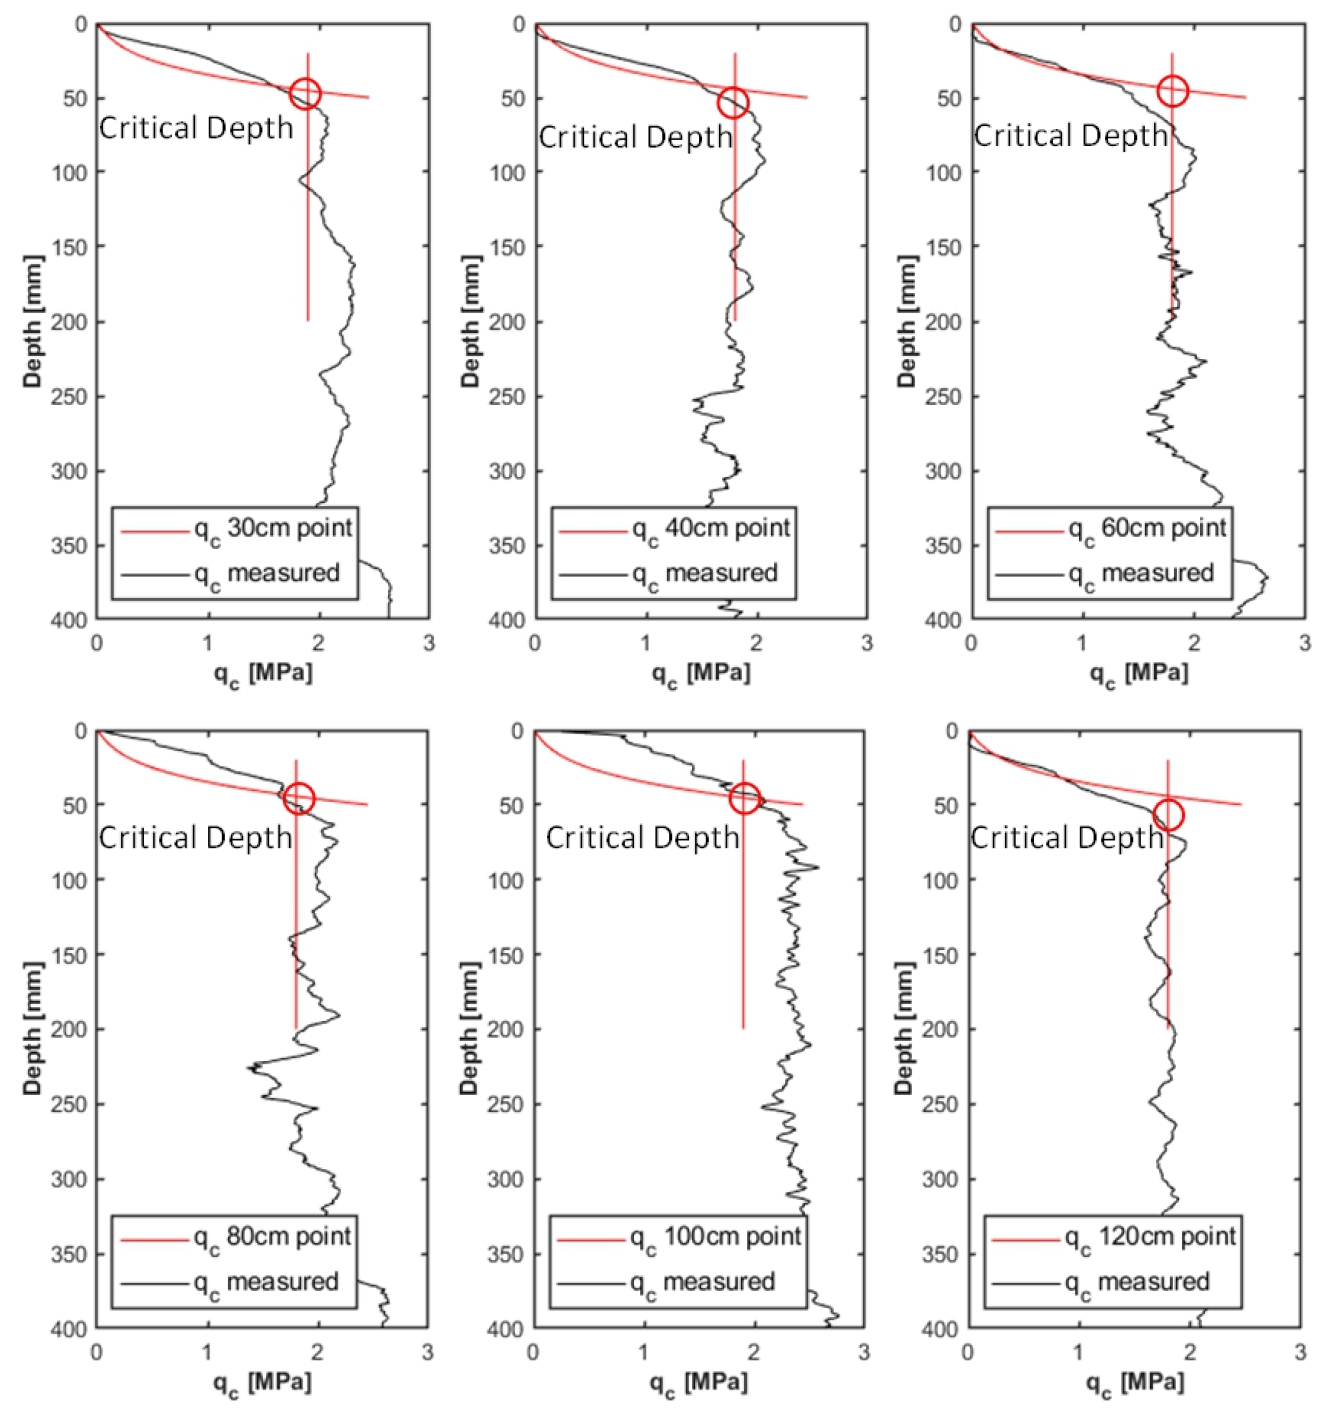
In laboratory Mini-CPT, researchers have estimated the cone penetration resistance using the formula by Biarez and Gressillon (1972) and compared these estimated values with the measured values (Puech and Foray, 2002a; Kim et al., 2016). The major input variable, the effective friction angle, was determined through direct shear tests. The dimensionless friction coefficient K for the cylindrical fracture surface was obtained by back analysis the experimental results using Equation (2). The coefficient K was found to be similar to the results proposed by Puech and Foray (2002b). Fig. 7 presents the comparison of these estimated values with the cone penetration resistance measured at each point. The results from the 10 cm and 40 cm points, which were affected by the influence range, were excluded from the comparison. The comparison showed that the results up to the critical depth of 50 mm were similar. The critical depth is the point where the rate of increase of cone resistance drastically reduces. This suggests that Mini-CPT is appropriate for laboratory experiment.
6. Conclusion
In this study, the Mini-Cone Penetration Test (Mini-CPT) was employed to investigate the cone penetration resistance in a model soil composed of silica sand. The Mini-CPT system, comprising the cone, actuator, and data logger, was effectively utilized for conducting penetration tests, providing reliable results. The following key conclusions can be drawn from the experiments conducted:
1.Four critical factors affecting Mini-CPT experiments were considered, including cone penetration rate, initial cone position, distance from the sidewall, and cone size relative to the model soil’s particle characteristics. These factors were carefully controlled to ensure consistent and reliable measurements.
2.The calibration process, which involved comparing Mini-CPT measurements with those from a load cell, resulted in a verification value of 0.6598, confirming the accuracy and reliability of the Mini-CPT system in measuring cone penetration resistance.
3. The experiments were conducted at different penetration points, varying distances from the soil box wall, and using different penetration rates. The results indicated that the distance from the wall and penetration rate had minimal influence on cone penetration resistance, while the penetration point significantly affected the measurements. Specifically, penetration at a distance of 10 cm exhibited much higher resistance compared to other points.
4.Additionally, the experiments showed that variations in cone penetration rate had relatively minor effects on cone penetration resistance.
5.The strong correlation between the measured and estimated resistances validates the precision of the Mini-CPT system in geotechnical assessments.
In summary, the Mini-CPT system was successfully utilized to assess cone penetration resistance in a model soil. The controlled experimental conditions and thorough calibration process ensured accurate and reliable results, providing valuable insights into the factors influencing cone penetration resistance in silica sand-based model soils. These findings contribute to a better understanding of cone penetration testing and its applications in laboratory test.
